k8s上のSpring Bootアプリからメトリクスを取得する(Actuator + Prometheus Operator)
はじめに
Kubernetes上でのSpring Bootのアプリのデバックを行なう際にPodのコンテナ内に応じて必要なコマンドとってきて、スレッドダンプやヒープダンプを取得してホストにコピーみたいなことをやっていたのですが、流石に面倒に感じはじめました。
そこでふとActuator入れりゃええやんと思いたち、どうせだったら、Prometeheusでメトリクスの収集までできればいろいろええんじゃないかと思いいろいろ動かしてみようと思います。
Spring Boot Actuatorとは
(まず、前提としてこのブログはBoot 2.4系のドキュメントを確認してます。貼られているリンクもそうなってると思います。)
Spring Boot Actuatorはアプリケーションをモニター、マネージするための追加機能を提供してくれています。HTTPやJMXのエンドポイントを通して操作を選択することができます(JMXを利用する場合はspring.jmx.enabledをtrueで設定する必要があります)。HTTPを利用する場合はデフォルトでは/actuator/{id}の形式で情報を取得することが可能で、たとえばhealthの情報を取得したい場合は/actuator/healthのエンドポイントで利用できます。カスタムエンドポイントを公開することもできますが、基本としては以下のようなエンドポイントが用意されています。
| ID | 説明 |
|---|---|
| health | アプリケーションの正常性情報を取得でる。このエンドポイントを通して、実行中のアプリケーション(本体と関連するアプリケーション)ステータスを確認することができる。関連するアプリケーションに関してはHealthContributorRegistryに定義されているすべてのHealthContributorから収集される。(詳細はこちら) |
| httptrace | HTTPのトレース情報(リクエスト/レスポンス)を取得できる。デフォルトで最新100個をインメモリに保存。HTTP トレースを有効にするには、アプリケーションの構成で HttpTraceRepository型をBeanとして提供する必要がある |
| beans | アプリケーション内のSpring Beanのリストを取得できる |
| mappings | @RequestMappingのパスのリストを表示します |
| shutdown | アップリケーションをシャットダウンする |
| threaddump | スレッドダンプを取得できる |
| heapdump | hprofヒープダンプを取得できる。アプリケーションがSpring MVCやWebFluxである場合に有効 |
| logfile | ログの内容を返す。logging.file.nameかlogging.file.pathプロパティが設定されている必要がある。アプリケーションがアプリケーションがSpring MVCやWebFluxである場合に有効 |
詳細なリストに関してはこちらをご覧ください。
また、Prometheusフォーマットで出力してくれるエンドポイントも提供されており今回はこちらを利用して、メトリクスを収集しようと思います。
エンドポイントの公開に関するセキュリティ的な考慮点に付いて
Actuatorでアプリケーションのインフラレイヤーやアプリケーションレイヤーで保護しておく必要があります。アプリケーションレイヤーでは「必要なエンドポイントのみ公開する」のが基本的な戦略となると思います。ActuatorではデフォルトでHTTPのエンドポイントはhealthとinfo以外は非公開になっているようです。
これらのエンドポイントを公開非公開を制御する場合は以下のようなincludeもしくはexcluedeプロパティを使用します。例えば、info, health, threaddumpのエンドポイントを公開したい場合は、アプリケーションプロパティで以下のように設定します。
management.endpoints.web.exposure.include=info, health, threaddump
その他のプロパティに関してはこちらをご覧ください。
単純な公開非公開とは別に、Spring Securityを利用している場合、そのコンテンツネゴシエーションの仕組みを利用してエンドポイントを保護することができます。例えば、特定のロールを持つユーザのみアクセス可能と言ったような制御を行なうことができます。
やっていく
環境
今回KubernetesのクラスタはMinikubeを用いてローカルに構成します。そのVMはデフォルトのDockerを利用します。
各ミドルウェア、OSのバージョンは以下のとおりです。
$ uname -srvmpio
Linux 5.4.0-70-generic #78-Ubuntu SMP Fri Mar 19 13:29:52 UTC 2021 x86_64 x86_64 x86_64 GNU/Linux

$ lsb_release -a
LSB Version:    core-11.1.0ubuntu2-noarch:security-11.1.0ubuntu2-noarch
Distributor ID: Ubuntu
Description:    Ubuntu 20.04.2 LTS
Release:    20.04
Codename:   focal


(Minikubeが動いているDocker)
$ docker version

(クライアントは省略)

Server: Docker Engine - Community
 Engine:
  Version:          20.10.5
  API version:      1.41 (minimum version 1.12)
  Go version:       go1.13.15
  Git commit:       363e9a8
  Built:            Tue Mar  2 20:16:15 2021
  OS/Arch:          linux/amd64
  Experimental:     true
 containerd:
  Version:          1.4.4
  GitCommit:        05f951a3781f4f2c1911b05e61c160e9c30eaa8e
 runc:
  Version:          1.0.0-rc93
  GitCommit:        12644e614e25b05da6fd08a38ffa0cfe1903fdec
 docker-init:
  Version:          0.19.0
  GitCommit:        de40ad0


$ minikube version
minikube version: v1.16.0
commit: 9f1e482427589ff8451c4723b6ba53bb9742fbb1

$ kubectl version -o yaml
clientVersion:
  buildDate: "2021-03-18T01:10:43Z"
  compiler: gc
  gitCommit: 6b1d87acf3c8253c123756b9e61dac642678305f
  gitTreeState: clean
  gitVersion: v1.20.5
  goVersion: go1.15.8
  major: "1"
  minor: "20"
  platform: linux/amd64
serverVersion:
  buildDate: "2020-12-08T17:51:19Z"
  compiler: gc
  gitCommit: af46c47ce925f4c4ad5cc8d1fca46c7b77d13b38
  gitTreeState: clean
  gitVersion: v1.20.0
  goVersion: go1.15.5
  major: "1"
  minor: "20"
  platform: linux/amd64
環境構築
プロジェクトの作成 & Ptometeusのメトリクスを取得できるように設定
まずは、プロジェクトを作成します。
プロジェクトはSpring Initializrを利用して以下のような構成で作成します。
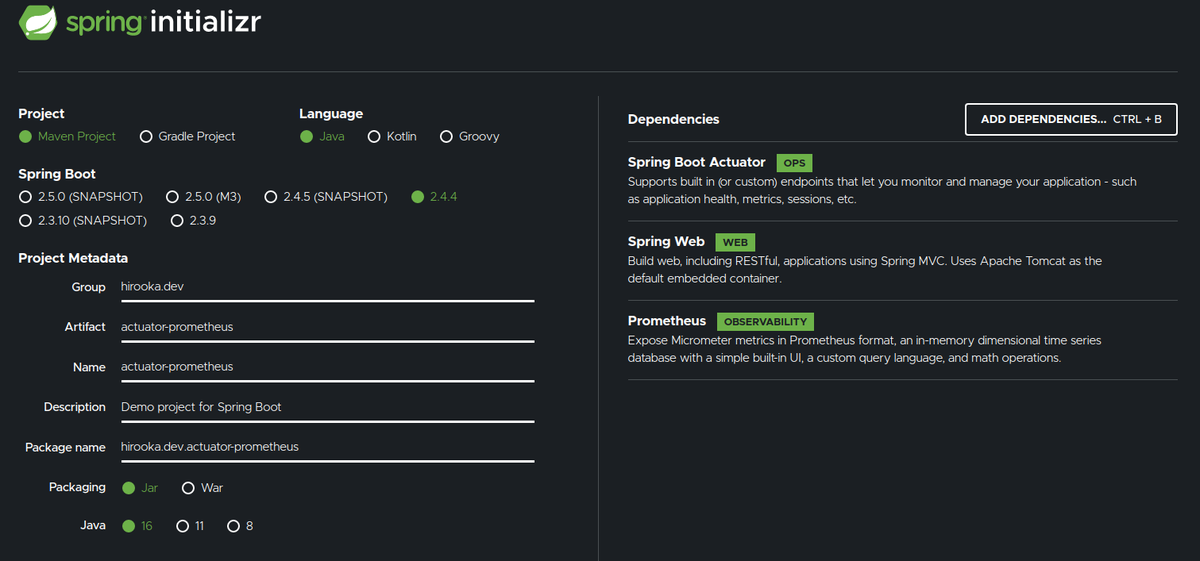
Webの他にActuatorとPrometheusの選択肢を選択肢てます。
出来上がったプロジェクトのPomの依存を確認すると以下の2つが存在することが確認できます。
<dependency>
    <groupId>org.springframework.boot</groupId>
    <artifactId>spring-boot-starter-actuator</artifactId>
</dependency>

<dependency>
    <groupId>io.micrometer</groupId>
    <artifactId>micrometer-registry-prometheus</artifactId>
    <scope>runtime</scope>
</dependency>
Actuatorの出力をPrometheusの形式で出力する場合micrometer-registry-prometheusの依存を追加する必要があります。今回は初期Initializrで追加しましたが、既存のBootプロジェクトにActuatorとPromtheusを使ってメトリクスの収集をする場合は上記の2つの依存を追加してやれば大丈夫だと思います。
コントローラーを作っておく
GETでリクエストを受けると文字列を返すコントローラーを作っておきます。
コンポーネントスキャン対象のパッケージ配下にいかのようなGreetingControllerを作成します。
@RestController
public class GreetingController {
    @GetMapping("/hello")
    public String hello(){
        return "hello, hello";
    }
}
起動してcURLで作ったコントローラーとActuatorのエンドポイントにアクセスしてみます。
$ curl localhost:8080/hello
hello, hello

$ curl localhost:8080/actuator/health
{"status":"UP"}
Prometheusのエンドポイントの公開設定を行なう
前述の通りActuatorのエンドポイントはhealthとinfo以外は非公開になっています。/actuatorにアクセスすると、公開されているエンドポイントの情報を取得することができます。
$ curl localhost:8080/actuator/ | jq
{
  "_links": {
    "self": {
      "href": "http://localhost:8080/actuator",
      "templated": false
    },
    "health": {
      "href": "http://localhost:8080/actuator/health",
      "templated": false
    },
    "health-path": {
      "href": "http://localhost:8080/actuator/health/{*path}",
      "templated": true
    },
    "info": {
      "href": "http://localhost:8080/actuator/info",
      "templated": false
    }
  }
Prometheus用のエンドポイントを公開するには、設定を追加する必要があります。
また、もともとの困りごとだったダンプの取得を行なうエンドポイントも公開しておきます。
アプリケーションプロパティに以下のように設定を行います。
# ついでにPort番号も変えておきます。
server.port=8888

management.endpoints.web.exposure.include=info, health, threaddump, prometheus, heapdump
再度/actuatorにアクセスしてみます。
$ curl localhost:8888/actuator | jq
{
  "_links": {
    "self": {
      "href": "http://localhost:8888/actuator",
      "templated": false
    },
    "health": {
      "href": "http://localhost:8888/actuator/health",
      "templated": false
    },
    "health-path": {
      "href": "http://localhost:8888/actuator/health/{*path}",
      "templated": true
    },
    "info": {
      "href": "http://localhost:8888/actuator/info",
      "templated": false
    },
    "heapdump": {
      "href": "http://localhost:8888/actuator/heapdump",
      "templated": false
    },
    "threaddump": {
      "href": "http://localhost:8888/actuator/threaddump",
      "templated": false
    },
    "prometheus": {
      "href": "http://localhost:8888/actuator/prometheus",
      "templated": false
    }
  }
}
yuya-hirooka@yuya-hirooka:~/source/java/actu
先程と比べて、設定したしたエンドポイントの情報が出力されているのがわかります。
Prometheus形式のメトリクスの取得をしてみます。
$ curl 'http://localhost:8888/actuator/prometheus'
# HELP jvm_memory_committed_bytes The amount of memory in bytes that is committed for the Java virtual machine to use
# TYPE jvm_memory_committed_bytes gauge
jvm_memory_committed_bytes{area="heap",id="G1 Survivor Space",} 0.0
jvm_memory_committed_bytes{area="heap",id="G1 Old Gen",} 5.4525952E7
jvm_memory_committed_bytes{area="nonheap",id="Metaspace",} 3.0539776E7
jvm_memory_committed_bytes{area="nonheap",id="CodeHeap 'non-nmethods'",} 2555904.0
jvm_memory_committed_bytes{area="heap",id="G1 Eden Space",} 4.6137344E7
jvm_memory_committed_bytes{area="nonheap",id="Compressed Class Space",} 4325376.0
jvm_memory_committed_bytes{area="nonheap",id="CodeHeap 'non-profiled nmethods'",} 6815744.0
# HELP tomcat_sessions_alive_max_seconds
# TYPE tomcat_sessions_alive_max_seconds gauge
tomcat_sessions_alive_max_seconds 0.0
# HELP jvm_threads_states_threads The current number of threads having NEW state
# TYPE jvm_threads_states_threads gauge
jvm_threads_states_threads{state="runnable",} 11.0
jvm_threads_states_threads{state="blocked",} 0.0
jvm_threads_states_threads{state="waiting",} 11.0
jvm_threads_states_threads{state="timed-waiting",} 4.0
jvm_threads_states_threads{state="new",} 0.0
jvm_threads_states_threads{state="terminated",} 0.0
# HELP system_cpu_usage The "recent cpu usage" for the whole system
# TYPE system_cpu_usage gauge
system_cpu_usage 1.0
# HELP jvm_gc_memory_promoted_bytes_total Count of positive increases in the size of the old generation memory pool before GC to after GC
# TYPE jvm_gc_memory_promoted_bytes_total counter
jvm_gc_memory_promoted_bytes_total 9284952.0
# HELP jvm_threads_peak_threads The peak live thread count since the Java virtual machine started or peak was reset
# TYPE jvm_threads_peak_threads gauge
jvm_threads_peak_threads 30.0
# HELP jvm_threads_daemon_threads The current number of live daemon threads
# TYPE jvm_threads_daemon_threads gauge
jvm_threads_daemon_threads 22.0
# HELP tomcat_sessions_active_current_sessions
# TYPE tomcat_sessions_active_current_sessions gauge
tomcat_sessions_active_current_sessions 0.0
# HELP jvm_buffer_total_capacity_bytes An estimate of the total capacity of the buffers in this pool
# TYPE jvm_buffer_total_capacity_bytes gauge
jvm_buffer_total_capacity_bytes{id="mapped - 'non-volatile memory'",} 0.0
jvm_buffer_total_capacity_bytes{id="mapped",} 0.0
jvm_buffer_total_capacity_bytes{id="direct",} 49152.0
# HELP system_load_average_1m The sum of the number of runnable entities queued to available processors and the number of runnable entities running on the available processors averaged over a period of time
# TYPE system_load_average_1m gauge
system_load_average_1m 2.04
# HELP jvm_memory_used_bytes The amount of used memory
# TYPE jvm_memory_used_bytes gauge
jvm_memory_used_bytes{area="heap",id="G1 Survivor Space",} 0.0
jvm_memory_used_bytes{area="heap",id="G1 Old Gen",} 1.8475864E7
jvm_memory_used_bytes{area="nonheap",id="Metaspace",} 3.016488E7
jvm_memory_used_bytes{area="nonheap",id="CodeHeap 'non-nmethods'",} 1257088.0
jvm_memory_used_bytes{area="heap",id="G1 Eden Space",} 0.0
jvm_memory_used_bytes{area="nonheap",id="Compressed Class Space",} 4117488.0
jvm_memory_used_bytes{area="nonheap",id="CodeHeap 'non-profiled nmethods'",} 6814208.0
# HELP system_cpu_count The number of processors available to the Java virtual machine
# TYPE system_cpu_count gauge
system_cpu_count 8.0
# HELP jvm_buffer_memory_used_bytes An estimate of the memory that the Java virtual machine is using for this buffer pool
# TYPE jvm_buffer_memory_used_bytes gauge
jvm_buffer_memory_used_bytes{id="mapped - 'non-volatile memory'",} 0.0
jvm_buffer_memory_used_bytes{id="mapped",} 0.0
jvm_buffer_memory_used_bytes{id="direct",} 49152.0
# HELP process_uptime_seconds The uptime of the Java virtual machine
# TYPE process_uptime_seconds gauge
process_uptime_seconds 231.285
# HELP tomcat_sessions_rejected_sessions_total
# TYPE tomcat_sessions_rejected_sessions_total counter
tomcat_sessions_rejected_sessions_total 0.0
# HELP tomcat_sessions_created_sessions_total
# TYPE tomcat_sessions_created_sessions_total counter
tomcat_sessions_created_sessions_total 0.0
# HELP logback_events_total Number of error level events that made it to the logs
# TYPE logback_events_total counter
logback_events_total{level="warn",} 0.0
logback_events_total{level="debug",} 0.0
logback_events_total{level="error",} 0.0
logback_events_total{level="trace",} 0.0
logback_events_total{level="info",} 7.0
# HELP jvm_classes_unloaded_classes_total The total number of classes unloaded since the Java virtual machine has started execution
# TYPE jvm_classes_unloaded_classes_total counter
jvm_classes_unloaded_classes_total 0.0
# HELP jvm_buffer_count_buffers An estimate of the number of buffers in the pool
# TYPE jvm_buffer_count_buffers gauge
jvm_buffer_count_buffers{id="mapped - 'non-volatile memory'",} 0.0
jvm_buffer_count_buffers{id="mapped",} 0.0
jvm_buffer_count_buffers{id="direct",} 6.0
# HELP process_cpu_usage The "recent cpu usage" for the Java Virtual Machine process
# TYPE process_cpu_usage gauge
process_cpu_usage 0.0
# HELP jvm_gc_live_data_size_bytes Size of long-lived heap memory pool after reclamation
# TYPE jvm_gc_live_data_size_bytes gauge
jvm_gc_live_data_size_bytes 1.8475864E7
# HELP jvm_gc_memory_allocated_bytes_total Incremented for an increase in the size of the (young) heap memory pool after one GC to before the next
# TYPE jvm_gc_memory_allocated_bytes_total counter
jvm_gc_memory_allocated_bytes_total 6.291456E7
# HELP tomcat_sessions_expired_sessions_total
# TYPE tomcat_sessions_expired_sessions_total counter
tomcat_sessions_expired_sessions_total 0.0
# HELP jvm_threads_live_threads The current number of live threads including both daemon and non-daemon threads
# TYPE jvm_threads_live_threads gauge
jvm_threads_live_threads 26.0
# HELP jvm_gc_pause_seconds Time spent in GC pause
# TYPE jvm_gc_pause_seconds summary
jvm_gc_pause_seconds_count{action="end of major GC",cause="Heap Dump Initiated GC",} 2.0
jvm_gc_pause_seconds_sum{action="end of major GC",cause="Heap Dump Initiated GC",} 0.077
jvm_gc_pause_seconds_count{action="end of minor GC",cause="G1 Evacuation Pause",} 1.0
jvm_gc_pause_seconds_sum{action="end of minor GC",cause="G1 Evacuation Pause",} 0.005
# HELP jvm_gc_pause_seconds_max Time spent in GC pause
# TYPE jvm_gc_pause_seconds_max gauge
jvm_gc_pause_seconds_max{action="end of major GC",cause="Heap Dump Initiated GC",} 0.0
jvm_gc_pause_seconds_max{action="end of minor GC",cause="G1 Evacuation Pause",} 0.0
# HELP http_server_requests_seconds
# TYPE http_server_requests_seconds summary
http_server_requests_seconds_count{exception="None",method="GET",outcome="SUCCESS",status="200",uri="/actuator/heapdump",} 2.0
http_server_requests_seconds_sum{exception="None",method="GET",outcome="SUCCESS",status="200",uri="/actuator/heapdump",} 0.425517121
http_server_requests_seconds_count{exception="None",method="GET",outcome="SUCCESS",status="200",uri="/actuator",} 1.0
http_server_requests_seconds_sum{exception="None",method="GET",outcome="SUCCESS",status="200",uri="/actuator",} 0.024393608
# HELP http_server_requests_seconds_max
# TYPE http_server_requests_seconds_max gauge
http_server_requests_seconds_max{exception="None",method="GET",outcome="SUCCESS",status="200",uri="/actuator/heapdump",} 0.0
http_server_requests_seconds_max{exception="None",method="GET",outcome="SUCCESS",status="200",uri="/actuator",} 0.0
# HELP process_start_time_seconds Start time of the process since unix epoch.
# TYPE process_start_time_seconds gauge
process_start_time_seconds 1.616906295082E9
# HELP tomcat_sessions_active_max_sessions
# TYPE tomcat_sessions_active_max_sessions gauge
tomcat_sessions_active_max_sessions 0.0
# HELP jvm_memory_max_bytes The maximum amount of memory in bytes that can be used for memory management
# TYPE jvm_memory_max_bytes gauge
jvm_memory_max_bytes{area="heap",id="G1 Survivor Space",} -1.0
jvm_memory_max_bytes{area="heap",id="G1 Old Gen",} 8.321499136E9
jvm_memory_max_bytes{area="nonheap",id="Metaspace",} -1.0
jvm_memory_max_bytes{area="nonheap",id="CodeHeap 'non-nmethods'",} 7553024.0
jvm_memory_max_bytes{area="heap",id="G1 Eden Space",} -1.0
jvm_memory_max_bytes{area="nonheap",id="Compressed Class Space",} 1.073741824E9
jvm_memory_max_bytes{area="nonheap",id="CodeHeap 'non-profiled nmethods'",} 2.44105216E8
# HELP jvm_classes_loaded_classes The number of classes that are currently loaded in the Java virtual machine
# TYPE jvm_classes_loaded_classes gauge
jvm_classes_loaded_classes 7304.0
# HELP process_files_open_files The open file descriptor count
# TYPE process_files_open_files gauge
process_files_open_files 60.0
# HELP jvm_gc_max_data_size_bytes Max size of long-lived heap memory pool
# TYPE jvm_gc_max_data_size_bytes gauge
jvm_gc_max_data_size_bytes 8.321499136E9
# HELP process_files_max_files The maximum file descriptor count
# TYPE process_files_max_files gauge
process_files_max_files 1048576.0
JVMの情報とか諸々が出力されてるが見て取れます。
threddump、heapdumpを取得するときは以下のようにします。
$ curl localhost:8888/actuator/threaddump -H 'Accept: text/plain' > threddump.txt
  % Total    % Received % Xferd  Average Speed   Time    Time     Time  Current
                                 Dload  Upload   Total   Spent    Left  Speed
100 30125  100 30125    0     0   668k      0 --:--:-- --:--:-- --:--:--  684k

$ curl 'http://localhost:8888/actuator/heapdump' -O
  % Total    % Received % Xferd  Average Speed   Time    Time     Time  Current
                                 Dload  Upload   Total   Spent    Left  Speed
100 27.6M  100 27.6M    0     0   124M      0 --:--:-- --:--:-- --:--:--  124M
Docker Imageの作成
アプリケーションの準備として最後に作成したアプリをDockerイメージ化しておきます。
ここで、今回はDockerのリポジトリを個別に用意したりDocker HubにイメージをPushのは面倒なので、Minikubeのコンテキストでイメージをビルドします。
具体的には次のコマンドを実行します。
$ eval $(minikube docker-env)
f

$ docker images
REPOSITORY                                TAG        IMAGE ID       CREATED         SIZE
kubernetesui/dashboard                    v2.1.0     9a07b5b4bfac   3 months ago    226MB
k8s.gcr.io/kube-proxy                     v1.20.0    10cc881966cf   3 months ago    118MB
k8s.gcr.io/kube-apiserver                 v1.20.0    ca9843d3b545   3 months ago    122MB
k8s.gcr.io/kube-scheduler                 v1.20.0    3138b6e3d471   3 months ago    46.4MB
k8s.gcr.io/kube-controller-manager        v1.20.0    b9fa1895dcaa   3 months ago    116MB
gcr.io/k8s-minikube/storage-provisioner   v4         85069258b98a   3 months ago    29.7MB
k8s.gcr.io/etcd                           3.4.13-0   0369cf4303ff   7 months ago    253MB
k8s.gcr.io/coredns                        1.7.0      bfe3a36ebd25   9 months ago    45.2MB
kubernetesui/metrics-scraper              v1.0.4     86262685d9ab   12 months ago   36.9MB
k8s.gcr.io/pause                          3.2        80d28bedfe5d   13 months ago   683kB
これで一時的にMinikubeのコンテキストでDocker ビルドできるようになりました。
minikube docker-envコマンドはMinikube組み込みのDockerデーモンをホストマシンから操作できるようにするためのコマンドです。
この状態でイメージをビルドします。
Spring Bootは2.3からBuildpackを利用したイメージのビルドをサポートしています。今回はその機能を利用してイメージを作成したいと思います。
具体的にはプロジェクトルートで以下のコマンドを実行します。
$ ./mvnw spring-boot:build-image -Dspring-boot.build-image.imageName=spring/actuator-prometheus

$ docker images | grep spring

$ docker images | grep spring/actuator-prometheus
spring/actuator-prometheus                                         latest                                          2b5438489b00   41 years ago    278MB
なんかCreatedがバグってる気がしますが、一旦はこれでOKです。
クラスターの設定 & 諸々のリソース作成
今回クラスターは以前のブログで作成したものを再利用しようと思います。構成としてはMinikubeで作ったクラスタにkube-promtheusを使ってPrometheusとGrafanaをデプロイ&設定を行っています。
PodMonitorを作成
通常、Prohetheusがk8sクラスタ内のサービスを見つける際にはkubernetes_sd_configをう場合が多いみたいですが、今回はkube-prometheusを利用しており、Kubernetes Operatorが利用できます。Kubernetes OperatorではPodMonitorとPodMetricsEndpointsというCRDが用意されており、そっちを利用してやってみようと思います。
以下のようなマニフェストファイルを用意します。
apiVersion: monitoring.coreos.com/v1
kind: PodMonitor
metadata:
  name: spring-app
  labels:
    backend: spring-app
spec:
  selector:
    matchLabels:
      app: spring-app
  podMetricsEndpoints:
  - port: app-port
  - path: /actuator/prometheus
ポイントはpodMetricsEndpointsのところで、ここにはPodで指定するポートの名前と、メトリクスを収集するPathを指定します。Actuatorはデフォルトでは/actuator/prometheusでメトリクスを公開しているので、そのパスを指定します。
作ったマニフェストをApplyしておきます。
$ kubectl apply -f pod-monitor.yaml
podmonitor.monitoring.coreos.com/spring-app created

$ kubectl get podmonitor
NAME         AGE
spring-app   19s
Doploymentを作成
それでは、Deploymentを作成して、作ったSpringのアプリをKubernetesにデプロイします。
まずは、--dry-runオプションを使ってベースとなるDeploymentを作成します。
$ kubectl create deployment spring-app --image=spring/actuator-prometheus --dry-run=client -o yaml
できたマニフェストを以下のように修正します。
apiVersion: apps/v1
kind: Deployment
metadata:
  creationTimestamp: null
  labels:
    app: spring-app
  name: spring-app
spec:
  replicas: 1
  selector:
    matchLabels:
      app: spring-app
  strategy: {}
  template:
    metadata:
      creationTimestamp: null
      labels:
        app: spring-app
    spec:
      containers:
      - image: spring/actuator-prometheus
        name: actuator-prometheus
        resources: {}
status: {}
このマニフェストを以下のように修正します。
apiVersion: apps/v1
kind: Deployment
metadata:
  creationTimestamp: null
  labels:
    app: spring-app
  name: spring-app
spec:
  replicas: 1
  selector:
    matchLabels:
      app: spring-app
  strategy: {}
  template:
    metadata:
      creationTimestamp: null
      labels:
        app: spring-app
    spec:
      containers:
      - image: spring/actuator-prometheus
        name: actuator-prometheus
        imagePullPolicy: IfNotPresent
        ports:
          - name: spring-app
            containerPort: 8888
        resources: {}
status: {}
具体的には
        imagePullPolicy: IfNotPresent
        ports:
          - name: spring-app
            containerPort: 8888
のところを追記しました。
imagePullPolicy: IfNotPresentはローカルにイメージがある場合はPullしないようの設定と、PodMonitorが利用するようにportに名前を付けています。
それではこのDeploymentをApplyします。
$ kubectl apply -f deployment.yaml
deployment.apps/spring-app created
Prometheusからメトリクスを確認する
実はここまでで大体設定が終わっていて、すでにPrometheusでのメトリクスの収集が始まってます。
Prometheusのダッシュボードでメトリクスを確認してみます。
まずは、デプロイされているプロメテウスにlocalhostでアクセスするためにポートフォワードを行います。
$ kubectl --namespace monitoring port-forward svc/prometheus-k8s 9090[f:id:yuya_hirooka:20210403140913p:plain]
Forwarding from 127.0.0.1:9090 -> 9090
Forwarding from [::1]:9090 -> 9090
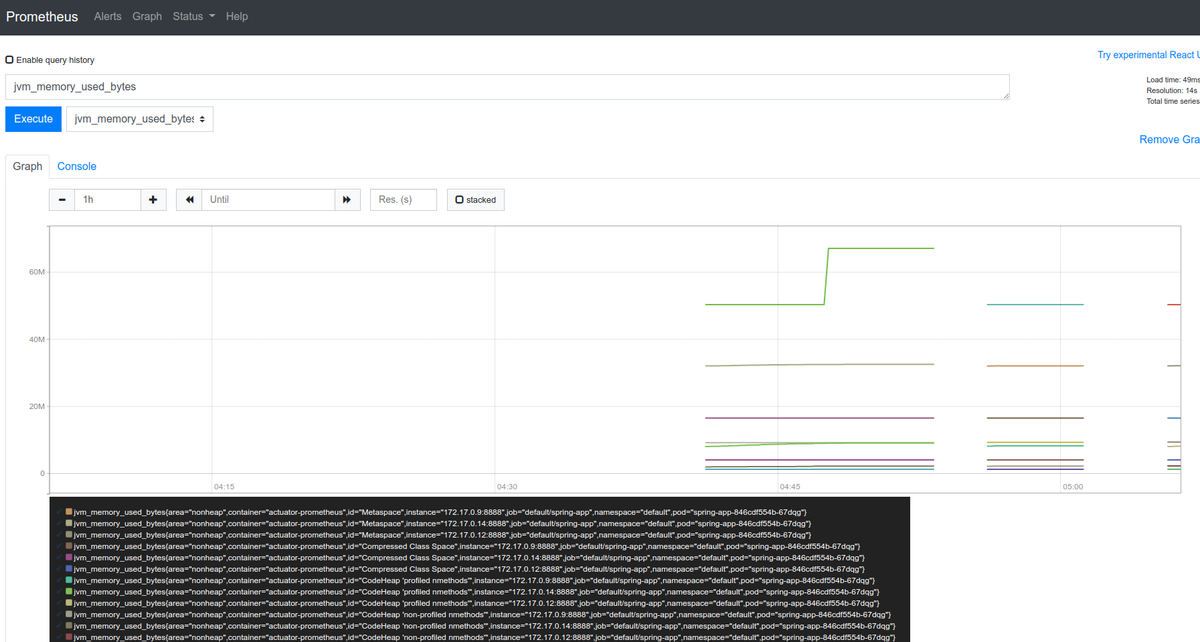
http://localhost:9090にアクセスしてUIから確認すると以下のようにJVMのメトリクスを取得できるようになっています。
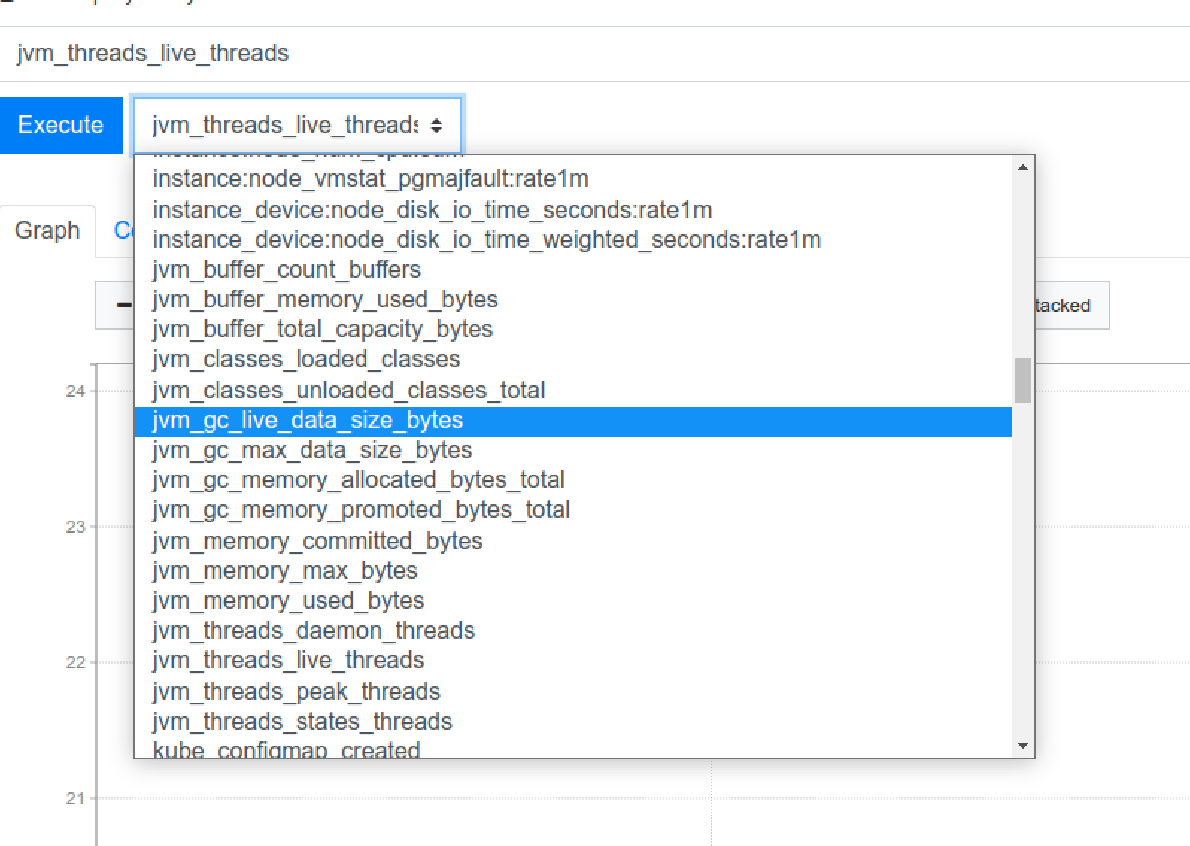
試しにjvm_memory_used_bytesをグラフ化してみると以下のようにヒープの領域ごとにいい感じにグラフ化できることが確認できました。