ScalaTestとScalaMockでテストを行なう
はじめに
今後Scalaを触ることになりそうになのでちょっと勉強しておこうかと思いまして、まずはテストのやり方を確認しようかと思いScalaTestとScalaMockを使ってユニットテストを書いてみようと思います。
書いてみる
環境
今回の環境は以下の通り
$ scala --version
Scala code runner version 3.0.0 -- Copyright 2002-2021, LAMP/EPFL

$ sbt --version
sbt version in this project: 1.5.2
sbt script version: 1.5.2
セットアップ
まず、sbtのプロジェクトはIntelliJのプラグインで作成しました。
ScalaTestのセットアップはこちらを参考に行います。
まずは、build.sbtに以下の依存を追加します。
libraryDependencies += "org.scalactic" %% "scalactic" % "3.2.9"
libraryDependencies += "org.scalamock" %% "scalamock" % "5.1.0" % Test
libraryDependencies += "org.scalatest" %% "scalatest" % "3.2.9" % "test"
sbtで依存を定義するための手っ取り早い方法はlibraryDependenciesに次のような構文で記述するようです。
libraryDependencies += groupID % artifactID % revision % configuration
ここでは3つ依存を定義しています。scalatestとscalamockに関しては良いとしてscalaitcですが、ScalaTestの姉妹ライブラリーで==オペレーターなどのテストやプロダクションコードで使えるような諸々を提供してくれるみたいです。今回使うかはわかりませんが、ドキュメントで依存に追加することが推奨されていたので追加しておこうと思います。
ScalaTestでユニットテストを記述する
ScalaTestのスタイルについて
ScalaTestでは以下のようなテストスタイルをサポートしているようです。
- FunSuiteスタイル
- FlatSpecスタイル
- FunSpecスタイル
- FreeSpecスタイル
それぞれのテストの書き方はこちらを参考にしてください。 最初のステップとしてはFlatSpecスタイルがおすすめされているようなので、このブログではFlatSpecを用いてテストを記述しようと思います。
単純なテストを書いてみる
まずは以下のような足し算をするだけの簡単なクラスを用意します。
class Calc {
  def plus(a: Int, b: Int): Int = a + b
}
このクラスのメソッドplusをテストするコードは以下のようになります。
import org.scalatest.flatspec.AnyFlatSpec
import org.scalatest.matchers.should

class CalcTest extends AnyFlatSpec with should.Matchers {

  it should "足し算の結果を返す" in {
    val c = new Calc
    c.plus(1, 2) should be (3)
  }
}
AnyFlatSpecはX should Yや A must Bのような形式でテストを記述するための構文を提供してくれます。
shouldやmust、canと行ったような助動詞の記述が可能なようです。
また、should.Matchersをミクスインしていますが、これは result should be (expected)のようにアサーションを記述するための構文を提供してくれます。
should.Matchersは以下のような構文を提供します。
- result should equal (expected)
- 比較がカスタマイズ可能
- result should === (expected)
- 比較がカスタマイズ可能
- 型の制約を強制する
- result should be (expected)
- 比較がカスタマイズができない代わりにコンパイルが早い
- result shouldEqual expected
- ()を必要としない
- カスタマイズ可能な比較
- result shouldBe 3
- ()を必要としない
- 比較がカスタマイズができない代わりにコンパイルが早い
should.Matchersの他にもAnyFlatSpecの上位のクラスでミクスインされているAssertionsトレイトではアサーションを行なうためのいくつかのマクロを定義されています。
このマクロには例えば以下のようなものがあります。
- fail
- テストを失敗させる
- succeed
- テストを成功させる
他にもさまざまなマクロがあります。詳細はこちらを確認ください。
それでは、記述したテストを実行してみます。
様々な実行方法がありますが、今回はsbtを使って実行したいと思います。
単純にすべてのテストを実行するためにはプロジェクトルートで以下のコマンドを実行します。
$ sbt

> test
[info] CalcSpec:
[info] - should 足し算の結果を返す
[info] CalcFunSuiteTest:
[info] - 足し算の結果を返す
[info] Run completed in 120 milliseconds.
[info] Total number of tests run: 2
[info] Suites: completed 2, aborted 0
[info] Tests: succeeded 2, failed 0, canceled 0, ignored 0, pending 0
[info] All tests passed.
[success] Total time: 0 s, completed 2021/05/29 23:15:25
CalcFunSuiteTestはブログには記載してませんが、同じテストを別のスタイルで書いているだけです。ここではそんなに気にしなくても大丈夫です。
すべてのテストでは無く一部のテストを実行したい場合は以下のように実行します。
> testOnly CalcSpec
[info] CalcSpec:
[info] - should 足し算の結果を返す
[info] Run completed in 324 milliseconds.
[info] Total number of tests run: 1
[info] Suites: completed 1, aborted 0
[info] Tests: succeeded 1, failed 0, canceled 0, ignored 0, pending 0
[info] All tests passed.
[success] Total time: 1 s, completed 2021/05/29 23:14:45
先程と違いCalcSpecだけが実行されたのがわかります。
例外をテストする
例外のテストを行なう場合もshould.Matchersで定義されているshould be thrownByを用います。
例えば先程のplusメソッドは正の数だけを受け取ることを想定しているメソッドで負の数を受け取った場合はIllegalArgumentExceptionを投げることを想定しているとします。
CalcSpecに以下のテストを追加します。
  it should "負の数が引数に渡された場合にIllegalArgumentException" in {
    val c = new Calc
    a[IllegalArgumentException] should be thrownBy {
      c.plus(1, -2)
    }
  }
このテストを実行すると以下の結果になります。
> testOnly CalcSpec
[info] CalcSpec:
[info] - should 足し算の結果を返す
[info] - should 負の数が引数に渡された場合 *** FAILED ***
[info]   Expected exception java.lang.IllegalArgumentException to be thrown, but no exception was thrown (CalcSpec.scala:13)
[info] Run completed in 118 milliseconds.
[info] Total number of tests run: 2
[info] Suites: completed 1, aborted 0
[info] Tests: succeeded 1, failed 1, canceled 0, ignored 0, pending 0
[info] *** 1 TEST FAILED ***
[error] Failed tests:
[error]         CalcSpec
[error] (Test / testOnly) sbt.TestsFailedException: Tests unsuccessful
[error] Total time: 0 s, completed 2021/05/29 23:22:03
まだ実装をしてないので失敗しますね。
それでは実装を行ってもう一度テストを実行します。
実装を以下のように修正します。
class Calc {
  def plus(a: Int, b: Int): Int = {
    require(a > 0 && b > 0)
    a + b
  }
}
Scalaの引数チェックはrequireメソッドを用いて行なうことができるようです。
こいつは条件に合致しない場合、IllegalArgumentExceptionを投げます。
テストを実行します。
> testOnly CalcSpec
[info] CalcSpec:
[info] - should 足し算の結果を返す
[info] - should 負の数が引数に渡された場合にIllegalArgumentException
[info] Run completed in 123 milliseconds.
[info] Total number of tests run: 2
[info] Suites: completed 1, aborted 0
[info] Tests: succeeded 2, failed 0, canceled 0, ignored 0, pending 0
[info] All tests passed.
[success] Total time: 0 s, completed 2021/05/29 23:29:27
実行が成功しましたね。
ScalaMockでモックする
次はScalaMockを使ってモックを行ってみようと思います。
例えば以下のようなトレイトとクラスがあったとします。
trait Language {
  def greeting(): String = "Hello!!"
}

class Person(val lang: Language) {
  def saySomeThing(): String = lang.greeting()
}

class Japanese extends Language {
  override def greeting(): String = "こんにちは"
}
このPersonクラスのsaySomeThingメソッドをテストし、Languageトレイトをモックするとします。
テストは以下のように記述します。
class PersonSpec extends AnyFlatSpec with should.Matchers with MockFactory {

  it should "Languageをモックする" in {
    val mockLang = mock[Language]
    (mockLang.greeting _).expects().returning("Hello, ScalaMock!!").once()

    val target = new Person(mockLang)
    target.saySomeThing() should be ("Hello, ScalaMock!!")
  }
}
MockFactoryをミクスインすることで、ScalaMockの構文を利用することができます。
まずは、val mockLang = mock[Language]のところでMockオブジェクトを作成します。
次に、(mockLang.greeting _).expects().returning("Hello, ScalaMock!!").once()のところで、モックの設定をしてます。
書いてあるとおりですがreturningでモックのが返す値を
モックが引数を期待する場合はexpects()の引数に渡すようです。
例えばなんでも良いがモックが1つの引数を期待する場合はexpects(*)とかけば良いようです。
そして最後に、once()ですがこのモックが1回実行されることを確認しています。
このテストを実行すると以下のような結果になります。
> testOnly PersonSpec
[info] PersonSpec:
[info] - should Languageをモックする
[info] Run completed in 132 milliseconds.
[info] Total number of tests run: 1
[info] Suites: completed 1, aborted 0
[info] Tests: succeeded 1, failed 0, canceled 0, ignored 0, pending 0
[info] All tests passed.
[success] Total time: 0 s, completed 2021/05/30 1:08:24
非同期でテストする
ScalaTestとScalaMockを非同期にするのは簡単でAsyncFlatSpecとAsyncMockFactoryを利用するだけです。
先程のPersonTestのテストを非同期で行なう用に書き換えます。
import org.scalamock.scalatest.AsyncMockFactory
import org.scalatest.flatspec.AsyncFlatSpec
import org.scalatest.matchers.should

class PersonSpec extends AsyncFlatSpec with should.Matchers with AsyncMockFactory {

  it should "Languageをモックする1" in {
    val mockLang = mock[Language]
    (mockLang.greeting _).expects().returning("Hello, ScalaMock!").once()

    val target = new Person(mockLang)
    target.saySomeThing() should be("Hello, ScalaMock!")
  }


  it should "Languageをモックする2" in {
    val mockLang = mock[Language]
    (mockLang.greeting _).expects().returning("Hello, ScalaMock!!").once()

    val target = new Person(mockLang)
    target.saySomeThing() should be("Hello, ScalaMock!!")
  }
}
AnyFlatSpecとMockFactoryを単純に置き換えただけです。
AnyFlatSpecに対するAsyncFlatSpecの用にスタイルごとに非同期用のものが用意されているようです。
実行すると以下のような結果になります。
> testOnly PersonSpec
[info] PersonSpec:
[info] - should Languageをモックする1
[info] - should Languageをモックする2
[info] Run completed in 151 milliseconds.
[info] Total number of tests run: 2
[info] Suites: completed 1, aborted 0
[info] Tests: succeeded 2, failed 0, canceled 0, ignored 0, pending 0
[info] All tests passed.
[success] Total time: 0 s, completed 2021/05/30 1:10:53
Spring Boot 2.5についてメモ
はじめに
今週(2020/5/20)にSpring Boot 2.5が出ましたが、どんなのが出たのかまとめて、なんとなく違いを把握おこうと思います。 基本的にはRelease Notesの内容を個人的に気になったところを少し深ぼって、自分の理解をまとめようと思うので、正確な情報は本家のブログやそれに付随する記事等をご参照ください(なるべく、情報ソースのリンクはつけます)。 ちなみに、ドキュメントに書かれた変更点を自分の理解でまとめたものなので、基本的に機能に対しては動作検証などは行っておりません。
2.4からの変更点
このブログでは以下のような変更点についてまとめます。
- DataSourceの初期化スクリプトに対するサポートの変更
- Actuator
/infoエンドポイントがよりセキュアに - 環境変数のプリフィクス
- HTTP/2 over TCP (h2c)
- R2DBCを用いたデータ初期化
- Docker Imageバインディングサポート
- ActuatorのPrometheusエンドポイントでOpenMetrics形式でのリソース公開
DataSourceの初期化スクリプトに対するサポートの変更
全体を眺めていると1番メインの変更っぽいです。
schema.sqlとdata.sqlに関するサポートがリデザインされています。
まず1つ目としてspring.datasource.*は非推奨になりspring.sql.init.*プロパティが新しく用意されました。
SqlInitializationProperties.javaでいろいろと定義されているみたいですね。
主なものをいかにまとめようと思います。spring.sql.init.のプリフィクスの部分は省略します。
| プロパティ名 | 説明 |
|---|---|
| schemaLocations | スキーマ(DDL)スクリプトのロケーション |
| dataLocations | データ(DML)スクリプトのロケーション |
| username | 初期化スクリプトを事項するユーザ名。もし別途設定が必要な場合 |
| password | 初期化スクリプトを事項するパスワード。もし別途設定が必要な場合 |
| continueOnError | エラーが発生してもスクリプト継続するか否か(デフォルトfalse) |
spring.datasource.*から初期化スクリプトに関わるプロパティが切り出された感じっぽいですね。
また、usernameとpasswordに関しては専用のものが用意されたみたいです。
Actuator /infoエンドポイントがよりセキュアに
デフォルトではActuatorの/infoエンドポイントがデフォルトでは公開されないようになりました。
しかし、Spring Securityがクラスパスにある場合は認証が求められるようになります。
2.5からの新しい機能
環境変数のプリフィクス
この機能で、同じ環境で複数のSpring Bootアプリケーションを実行、設定を行なうことができます。
SpringApplication.setEnvironmentPrefix(…)を利用することで、この機能を利用できます。
例えばmyappというプリフィクスを付けてアプリケーションを起動する場合は以下のようにすれば可能になります。
SpringApplication application = new SpringApplication(MyApp.class);
application.setEnvironmentPrefix("myapp");
application.run(args);
この設定を行なうことで、すべてのプロパティを環境変数で変更するためにプリフィクスをつける必要があります。
例えば、ポートを変更したい場合はMYAPP_SERVER_PORTを設定する必要があります。
ちょっと動かしてみましたが、上記の設定が行われている場合SERVER_PORTではポートの変更を行なうことはできませんでした。
HTTP/2 over TCP (h2c)
マニュアル設定は無しで、HTTP/2 over TCP (h2c)、TSLではないHTTPでのHTTP/2の利用が可能となりました。
この機能を利用するためにはserver.http2.enabled=trueを設定して、かつserver.ssl.enabled=falseに設定する必要があります。
実際の実行結果は以下のようになります。
$ curl http://localhost:8080/hello -v --http2
*   Trying 127.0.0.1:8080...
* TCP_NODELAY set
* Connected to localhost (127.0.0.1) port 8080 (#0)
> GET /hello HTTP/1.1
> Host: localhost:8080
> User-Agent: curl/7.68.0
> Accept: */*
> Connection: Upgrade, HTTP2-Settings
> Upgrade: h2c
> HTTP2-Settings: AAMAAABkAARAAAAAAAIAAAAA
>
* Mark bundle as not supporting multiuse
< HTTP/1.1 101
< Connection: Upgrade
< Upgrade: h2c
< Date: Sun, 23 May 2021 08:59:28 GMT
* Received 101
* Using HTTP2, server supports multi-use
* Connection state changed (HTTP/2 confirmed)
* Copying HTTP/2 data in stream buffer to connection buffer after upgrade: len=0
* Connection state changed (MAX_CONCURRENT_STREAMS == 100)!
< HTTP/2 200
< content-type: text/plain;charset=UTF-8
< content-length: 10
< date: Sun, 23 May 2021 08:59:28 GMT
<
* Connection #0 to host localhost left intact
Hello, 2.5
R2DBCを用いたデータ初期化
R2DBCを通して、スクリプトベースの初期化が可能になりました。
クラスパスにschema.sqlとdata.sqlというスクリプトファイルがある場合は自動的に実行されるようになります。
また、JDBC同様にspring.sql.init.*プロパティを通して設定が可能です。
Docker Imageバインディングサポート
Custom Buildpacksのサポート
Custom BuildpacksがMavenでもGradleでもサポートされるようになりました。
buildpacksプロパティにディレクトリ、tar.gz、ビルダー、Dockerイメージを指定することができます。
バインディング
Mavanでも、GradleでもVolumeバインディングがサポートされました。
この機能のおかげでBuildpacksnがローカルのパスやDocker Volumeをバインドすることができます。
ActuatorのPrometheusエンドポイントでOpenMetrics形式でのリソース公開
Actuatorの/actuator/prometheusエンドポイントで通常のPrometheusの形式とOpenMetricsの形式でレスポンスを返すことが可能になってます。
application/openmetrics-text;version=1.0.0のようなヘッダーをつけることで、OpenMetricsのレスポンスを受け取ることが可能です。
Dependency Upgrades
ここに書かれるように複数の依存がアップグレードされています。
Ktorのログ出力をJsonに変える
はじめに
まえにQuarkusで同じようなことをやったのですが、Ktorだとどうなるんだろうとふと思ってやってみようと思います。
先にお伝えしておくと、タイトル詐欺ではないですが、ほぼLogbackの設定の話になりKtor特有のものはなさそうでした。
主題とは関係ないですが、KtorにはCallLoggingと呼ばれるようなリクエストのロギングを行ってれるモジュール?は用意されているみたいなのでそちらもおまけとして使ってみようと思います。
やってみる
実行環境
アプリの実行環境は以下のようになっています。
$ uname -srvmpio
Linux 5.4.0-72-generic #80-Ubuntu SMP Mon Apr 12 17:35:00 UTC 2021 x86_64 x86_64 x86_64 GNU/Linux

$ lsb_release -a
LSB Version:    core-11.1.0ubuntu2-noarch:security-11.1.0ubuntu2-noarch
Distributor ID: Ubuntu
Description:    Ubuntu 20.04.2 LTS
Release:    20.04
Codename:   focal

$ java -version
openjdk version "1.8.0_292"
OpenJDK Runtime Environment (build 1.8.0_292-b10)
OpenJDK 64-Bit Server VM (build 25.292-b10, mixed mode)

$ mvn --version
Apache Maven 3.6.3
Maven home: /usr/share/maven
Java version: 1.8.0_292, vendor: Oracle Corporation, runtime: /home/yuya-hirooka/.sdkman/candidates/java/8.0.292-open/jre
Default locale: ja_JP, platform encoding: UTF-8
OS name: "linux", version: "5.4.0-73-generic", arch: "amd64", family: "unix"
プロジェクトを作成する
Ktor Project Generatorを使ってプロジェクトを作成します。
設定は以下のとおりにします。

プロジェクトは個人の趣味でMavenで作成してます。
プロジェクトをダウンロードして解答し、適当なIDEなり何なりで開きます。
起動してみる
デフォルトでは以下のようなApplication.ktというクラスがされています。
fun main(args: Array<String>): Unit = io.ktor.server.netty.EngineMain.main(args)

@Suppress("unused") // Referenced in application.conf
@kotlin.jvm.JvmOverloads
fun Application.module(testing: Boolean = false) {
    routing {
        get("/") {
            call.respondText("HELLO WORLD!", contentType = ContentType.Text.Plain)
        }
    }
}
localhost:8080/でHELLO WORLD!の文字列を返すハンドラーが用意されているみたいです。
起動してみます。
$ mvn compile exec:java -Dexec.mainClass=dev.hirooka.ApplicationKt
現段階では起動時に以下のようなログが出力されます。
2021-05-21 20:22:32.657 [dev.hirooka.ApplicationKt.main()] TRACE Application - {
    # application.conf @ file:/home/yuya-hirooka/source/kotlin/ktor-sandbox/logging/target/classes/application.conf: 6
    "application" : {
        # application.conf @ file:/home/yuya-hirooka/source/kotlin/ktor-sandbox/logging/target/classes/application.conf: 7
        "modules" : [
            # application.conf @ file:/home/yuya-hirooka/source/kotlin/ktor-sandbox/logging/target/classes/application.conf: 7
            "dev.hirooka.ApplicationKt.module"
        ]
    },
    # application.conf @ file:/home/yuya-hirooka/source/kotlin/ktor-sandbox/logging/target/classes/application.conf: 2
    "deployment" : {
        # application.conf @ file:/home/yuya-hirooka/source/kotlin/ktor-sandbox/logging/target/classes/application.conf: 3
        "port" : 8080
    },
    # Content hidden
    "security" : "***"
}

2021-05-21 20:22:32.690 [dev.hirooka.ApplicationKt.main()] INFO  Application - Autoreload is disabled because the development mode is off.
2021-05-21 20:22:32.901 [dev.hirooka.ApplicationKt.main()] INFO  Application - Responding at http://0.0.0.0:8080
curlでエンドポイントにアクセスしてみます。
$ curl localhost:8080
HELLO WORLD!
アクセスログを出すようにしてみる
前述の通り、Ktorでは流入するリクエストの情報を出力してくれるCallLogging言うのものを用意してくれています。
使い方は簡単でただinstallするだけでOkです。
Application.ktを以下のように書き換えます。
@Suppress("unused") // Referenced in application.conf
@kotlin.jvm.JvmOverloads
fun Application.module(testing: Boolean = false) {
    routing {
        get("/") {
            call.respondText("HELLO WORLD!", contentType = ContentType.Text.Plain)
        }
    }
    // 追加した部分
    install(CallLogging)
}
アプリケーションを再起動して先ほどと同様のリクエストを送ると以下のようなログ出力が行われるようになります。
2021-05-21 20:46:37.840 [eventLoopGroupProxy-4-1] TRACE Application - 200 OK: GET - /
ログをJsonで出力するように変更
KtorはSLF4Jを利用したロギングが行えるようで、Project Generatorでアプリを作成した場合その実装はlogback-classicになるようです。
なので、Ktorのログ出力を変えたい場合をLogbackの出力をJsonに変える方法と同様な方法で行えます。
今回は、Logstashを使ってみたいと思います。
まずはpomの依存に以下を追加します。
<dependency>
    <groupId>net.logstash.logback</groupId>
    <artifactId>logstash-logback-encoder</artifactId>
    <version>6.6</version>
</dependency>
バージョンは最新を確認して入れるようにしてください。
次にLogbackの設定を変更してエンコーダーをLogstashのものを使うようにします。
resourceディレクトリ配下にあるlogback.xmlを以下のように修正します。
<configuration>
    <appender name="STDOUT" class="ch.qos.logback.core.ConsoleAppender">
<!--        <encoder>-->
<!--            <pattern>%d{YYYY-MM-dd HH:mm:ss.SSS} [%thread] %-5level %logger{36} - %msg%n</pattern>-->
<!--        </encoder>-->
        <encoder class="net.logstash.logback.encoder.LogstashEncoder" />
    </appender>
    <root level="trace">
        <appender-ref ref="STDOUT"/>
    </root>
    <logger name="org.eclipse.jetty" level="INFO"/>
    <logger name="io.netty" level="INFO"/>
</configuration>
もともとあったencoderタグの部分をコメントアウトして、net.logstash.logback.encoder.LogstashEncoderをエンコーダーとして使用するようにしてます。
これで設定は完了です。
プロジェクトを再起動してみると今度はLogがJson形式で出力されるようになったのがわかります。
{"@timestamp":"2021-05-21T20:40:48.994+09:00","@version":"1","message":"{\n    # application.conf @ file:/home/yuya-hirooka/source/kotlin/ktor-sandbox/logging/target/classes/application.conf: 6\n    \"application\" : {\n        # application.conf @ file:/home/yuya-hirooka/source/kotlin/ktor-sandbox/logging/target/classes/application.conf: 7\n        \"modules\" : [\n            # application.conf @ file:/home/yuya-hirooka/source/kotlin/ktor-sandbox/logging/target/classes/application.conf: 7\n            \"dev.hirooka.ApplicationKt.module\"\n        ]\n    },\n    # application.conf @ file:/home/yuya-hirooka/source/kotlin/ktor-sandbox/logging/target/classes/application.conf: 2\n    \"deployment\" : {\n        # application.conf @ file:/home/yuya-hirooka/source/kotlin/ktor-sandbox/logging/target/classes/application.conf: 3\n        \"port\" : 8080\n    },\n    # Content hidden\n    \"security\" : \"***\"\n}\n","logger_name":"Application","thread_name":"dev.hirooka.ApplicationKt.main()","level":"TRACE","level_value":5000}
{"@timestamp":"2021-05-21T20:40:49.038+09:00","@version":"1","message":"Autoreload is disabled because the development mode is off.","logger_name":"Application","thread_name":"dev.hirooka.ApplicationKt.main()","level":"INFO","level_value":20000}
{"@timestamp":"2021-05-21T20:40:49.339+09:00","@version":"1","message":"Responding at http://0.0.0.0:8080","logger_name":"Application","thread_name":"dev.hirooka.ApplicationKt.main()","level":"INFO","level_value":20000}
スタックトレースを出力する
上記の設定ではスタックトレースの出力がされず別途設定が必要のようです。
logback.xmlを以下のように書き換えます。
<configuration>
    <appender name="STDOUT" class="ch.qos.logback.core.ConsoleAppender">
        <!--    <appender name="STDOUT" class="net.logstash.logback.appender.AccessEventAsyncDisruptorAppender">-->
        <!--        <encoder>-->
        <!--            <pattern>%d{YYYY-MM-dd HH:mm:ss.SSS} [%thread] %-5level %logger{36} - %msg%n</pattern>-->
        <!--        </encoder>-->
        <encoder class="net.logstash.logback.encoder.LogstashEncoder">
            <throwableConverter class="net.logstash.logback.stacktrace.ShortenedThrowableConverter">
                <maxDepthPerThrowable>30</maxDepthPerThrowable>
                <maxLength>2048</maxLength>
                <shortenedClassNameLength>20</shortenedClassNameLength>
                <exclude>sun\.reflect\..*\.invoke.*</exclude>
                <exclude>net\.sf\.cglib\.proxy\.MethodProxy\.invoke</exclude>
                <rootCauseFirst>true</rootCauseFirst>
                <inlineHash>true</inlineHash>
            </throwableConverter>
        </encoder>
    </appender>
    <root level="trace">
        <appender-ref ref="STDOUT"/>
    </root>
    <logger name="org.eclipse.jetty" level="INFO"/>
    <logger name="io.netty" level="INFO"/>
</configuration>
これでスタックトレースの情報もログ出力されるようになります。
Application.ktを以下のように書き換えます。
@Suppress("unused") // Referenced in application.conf
@kotlin.jvm.JvmOverloads
fun Application.module(testing: Boolean = false) {
    routing {
        get("/") {
            throw RuntimeException("opps!!")
            //call.respondText("HELLO WORLD!", contentType = ContentType.Text.Plain)
        }
    }
    install(CallLogging)
}
curlでリクエストを送ると以下のようなログが出力されます。
{"@timestamp":"2021-05-21T21:38:19.628+09:00","@version":"1","message":"{\n    # application.conf @ file:/home/yuya-hirooka/source/kotlin/ktor-sandbox/logging/target/classes/application.conf: 6\n    \"application\" : {\n        # application.conf @ file:/home/yuya-hirooka/source/kotlin/ktor-sandbox/logging/target/classes/application.conf: 7\n        \"modules\" : [\n            # application.conf @ file:/home/yuya-hirooka/source/kotlin/ktor-sandbox/logging/target/classes/application.conf: 7\n            \"dev.hirooka.ApplicationKt.module\"\n        ]\n    },\n    # application.conf @ file:/home/yuya-hirooka/source/kotlin/ktor-sandbox/logging/target/classes/application.conf: 2\n    \"deployment\" : {\n        # application.conf @ file:/home/yuya-hirooka/source/kotlin/ktor-sandbox/logging/target/classes/application.conf: 3\n        \"port\" : 8080\n    },\n    # Content hidden\n    \"security\" : \"***\"\n}\n","logger_name":"Application","thread_name":"main","level":"TRACE","level_value":5000}
{"@timestamp":"2021-05-21T21:38:19.670+09:00","@version":"1","message":"Autoreload is disabled because the development mode is off.","logger_name":"Application","thread_name":"main","level":"INFO","level_value":20000}
{"@timestamp":"2021-05-21T21:38:19.957+09:00","@version":"1","message":"Responding at http://0.0.0.0:8080","logger_name":"Application","thread_name":"main","level":"INFO","level_value":20000}
{"@timestamp":"2021-05-21T21:38:19.957+09:00","@version":"1","message":"Application started: io.ktor.application.Application@39d9314d","logger_name":"Application","thread_name":"main","level":"TRACE","level_value":5000}
{"@timestamp":"2021-05-21T21:38:21.593+09:00","@version":"1","message":"hello","logger_name":"Application","thread_name":"eventLoopGroupProxy-4-1","level":"INFO","level_value":20000}
{"@timestamp":"2021-05-21T21:38:21.597+09:00","@version":"1","message":"Unhandled: GET - /","logger_name":"Application","thread_name":"eventLoopGroupProxy-4-1","level":"ERROR","level_value":40000,"stack_trace":"<#f0019090> j.l.RuntimeException: hello\n\tat d.h.ApplicationKt$module$1$1.invokeSuspend(Application.kt:17)\n\tat d.h.ApplicationKt$module$1$1.invoke(Application.kt)\n\tat i.k.u.p.SuspendFunctionGun.loop(SuspendFunctionGun.kt:246)\n\tat i.k.u.p.SuspendFunctionGun.proceed(SuspendFunctionGun.kt:116)\n\tat i.k.u.p.SuspendFunctionGun.execute(SuspendFunctionGun.kt:136)\n\tat i.k.u.p.Pipeline.execute(Pipeline.kt:79)\n\tat i.k.routing.Routing.executeResult(Routing.kt:155)\n\tat i.k.routing.Routing.interceptor(Routing.kt:39)\n\tat i.k.r.Routing$Feature$install$1.invokeSuspend(Routing.kt:107)\n\tat i.k.r.Routing$Feature$install$1.invoke(Routing.kt)\n\tat i.k.u.p.SuspendFunctionGun.loop(SuspendFunctionGun.kt:246)\n\tat i.k.u.p.SuspendFunctionGun.proceed(SuspendFunctionGun.kt:116)\n\tat i.k.f.CallLogging$Feature$install$2.invokeSuspend(CallLogging.kt:139)\n\tat i.k.f.CallLogging$Feature$install$2.invoke(CallLogging.kt)\n\tat i.k.u.p.SuspendFunctionGun.loop(SuspendFunctionGun.kt:246)\n\tat i.k.u.p.SuspendFunctionGun.proceed(SuspendFunctionGun.kt:116)\n\tat i.k.u.p.SuspendFunctionGun.execute(SuspendFunctionGun.kt:136)\n\tat i.k.u.p.Pipeline.execute(Pipeline.kt:79)\n\tat i.k.s.e.DefaultEnginePipelineKt$defaultEnginePipeline$2.invokeSuspend(DefaultEnginePipeline.kt:124)\n\tat i.k.s.e.DefaultEnginePipelineKt$defaultEnginePipeline$2.invoke(DefaultEnginePipeline.kt)\n\tat i.k.u.p.SuspendFunctionGun.loop(SuspendFunctionGun.kt:246)\n\tat i.k.u.p.SuspendFunctionGun.proceed(SuspendFunctionGun.kt:116)\n\tat i.k.u.p.SuspendFunctionGun.execute(SuspendFunctionGun.kt:136)\n\tat i.k.u.p.Pipeline.execute(Pipeline.kt:79)\n\tat i.k.s.n.NettyApplicationCallHandler$handleRequest$1.invokeSuspend(NettyApplicationCallHandler.kt:123)\n\tat i.k.s.n.NettyApplicationCallHandler$handleRequest$1.invoke(NettyApplicationCallHandler.kt)\n\tat k.c.i.UndispatchedKt.startCoroutineUndispatched(Undispatched.kt:55)\n\tat k.c.BuildersKt__Builders_commonKt.startCoroutineImpl(Builders.common.kt:194)\n\tat k.c.BuildersKt.startCoroutineImpl(Unknown Source:1)\n\tat k.c.AbstractCoroutine.start(AbstractCoroutine.kt:145)\n\t... 1..."}
Raspberry PiでKubernetes The Hard Way(v1.21.0)をやる(失敗)
はじめに
最近、Raspberry Piを買ってKubeadmを使ってKubernetesのクラスタを構築してみたので今度は、「Kubernetes The Hard Way」をやってみようと思います。
Kubernetes The Hard Way自体は、VirutalBoxを使ってやったみたことはあったのですが、その当時はほぼ手順をなぞっただけで終わってしまったので今回はきちんと理解を整理しながらやってみようかと思います。
....と思ったのですが、最終的には失敗してしまいました。
クラスターのネットワークの設定にflannelを使ったのですが、Podのネットワークにサブネットが割当されず。
クラスター側のサブネットとかぶってないかとか諸々確認したのですが、うまく行かず。一旦は断念しました。
とはいえせっかくまとめたメモとかを、そのまま消してしまうのももったいないので、最後に雑にまとめて投稿だけしようと思います。
ちょっと別の理由で環境を壊してしまった都合上、問題の分析なども行えていない(本当に、どういうログが出てて困ったのかすらも載せてない)中途半端なブログになっているので、もし何かを期待してみられる方がいるのであればおそらくこのブログは期待に添えるものではありません。
やってみる
環境構築
クライアントマシン
Kubernetesのクラスタはラズパイ上に構築しますが、それぞれのラズパイにsshしたり必要なリソースを作成したりするためにThinkPadのPCを用います。
環境は以下のとおりです。
$ uname -srvmpio
Linux 5.4.0-72-generic #80-Ubuntu SMP Mon Apr 12 17:35:00 UTC 2021 x86_64 x86_64 x86_64 GNU/Linux

$ lsb_release -a
LSB Version:    core-11.1.0ubuntu2-noarch:security-11.1.0ubuntu2-noarch
Distributor ID: Ubuntu
Description:    Ubuntu 20.04.2 LTS
Release:    20.04
Codename:   focal
Raspberry Piともろもろ
ラズベリーパイ含め今回は以下のものを使って物理的な環境を構築します。
もともと家にあったのもありますが、PC以外で全部で3万円強ぐらい だったと思います。
Aamazonのリンクを貼っているものは実際に自分が購入したものです。
| 名前 | 説明 | 個数 |
|---|---|---|
| Raspberry Pi 3 Model B+ | 1GのRAMを持つラズパイです。秋葉原でリフレッシュ品を2つ適当に購入しました。こちらはサブNodeとして使おうと思います。 | 2 |
| Raspberry Pi 4 ModelB 4GB | 4GのRAMを持つラズパイです。Amazonで購入しました。こちらはMasterのNodeとして使おうと思います。 | 1 |
| Micro SD 32G | ラズパイのディスクとして使用します。Aamazonで購入しました。 | 3 |
| ルータ親機 | ラズパイをWiFiに接続したかったので、Aamazonで購入しました。 | 1 |
| ロジテック スイッチングハブ 5ポート | ラズパイでネットワークを構築するためにAamazonで買いました。 | 1 |
| AUKEY USB充電器 50W/10A ACアダプター 5ポート | ラズパイと諸々の電源として使います。 | 1 |
| Raspberry Pi 4 ケース | 4とありますが、3でも使えます。4段構成で、1つの段は電源を置くために使います。 | |
| Micro-USBケーブル | Raspberry Pi 3、スイッチングパブ、ルータ親機の電源コードとして使います。配線が邪魔にならないように短めのものを使います。 | 4 |
| USB type C | Raspberry Pi 4の電源コードとして使います。配線が邪魔にならないように短めのものを使います | 1 |
| LANケーブル | ラズパイとハブ、ハブとルータ親機をそれぞれつなぎます。 | 4 |
| HDMIケーブル | ディスプレイとラズパイをつなぎます。 | 1 |
| Micro HDMI変換コネクタ | Raspberry Pi 4を画面につなぐために使いました | 1 |
| ThinkPad T490 | もともと持ってたPCです。Micro SDにOSのイメージを焼いたり、sshしてラズパイに諸々インストールしたりするのに使います。 | 1 |
| ディスプレイ | もともと持っていたものを使います | 1 |
配線する
詳細に説明はしませんが、最終的には以下のように配線します。
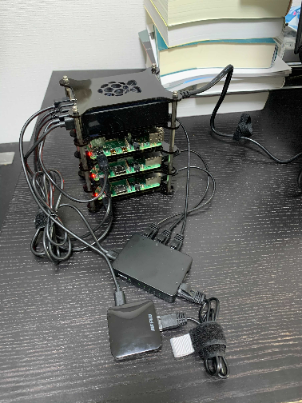
ラズパイ⇨電源、スイッチングハブ スイッチングハブ⇨電源、ルータ親機 ルータ親機⇨電源 ThinkPad⇨スイッチングハブ
また、ルータ親機に関しては説明書を読みつつ自宅の無線LANに接続できるようにしておきます。
画像では電源もすでに入ってますが、この段階では大本の電源のケーブルを抜いておき、まだ電源を入れないようにしておきます。
Micro SDカードをラズパイに入れてから電源を指します。
Micro SDにUbuntuをインストールする
配線ができたら次にMicro SDにOSのイメージを焼いていきます。
今回はOSはUbuntuを使いたいと思います。Raspberry Pi 3には「Ubuntu Server 18.04.5 Arm64」のイメージ、Raspberry Pi 4には「Ubuntu Server 20.04.2 Arm64」を利用します。
それぞれ以下のページからダウンロードしてきます。
ダウンロードしてきたイメージをSDカードに焼きます。Micro SDの場合は/dev/mmcblk0にイメージを焼けば良さそうです。
以下のコマンドをそれぞれのSDカードをPCの組み込みSDカードドライブに差し込んでから実行します。
$ xzcat ubuntu-18.04.5-preinstalled-server-arm64+raspi3.img.xz | sudo dd bs=4M of=/dev/mmcblk0
0+318958 レコード入力
0+318958 レコード出力
2653289472 bytes (2.7 GB, 2.5 GiB) copied, 29.1715 s, 91.0 MB/s
Raspberry Pi 4に利用するSDカードにはubuntu-20.04.2-preinstalled-server-arm64+raspi.img.xzという名前のイメージがダウンロードされると思うので、同じコマンドを実行してください。
3枚のMicro SDカードにイメージを焼き終わったら、ラズパイに差し込んで電源を入れます。
また、ディスプレイと
電源を入れるとUbuntuのインストールがはじまります。
しばらく待つと初期ユーザネーム/パスワードを聞かれるので、ubuntu/ubuntuと入力してください。
初回のパスワード変更では任意のものを入力してください。
同様の作業をすべのSDカードで行ってください「Ubuntu20+Raspberry Pi 4」でも同様のセットアップを行ってください。
Ubuntuが起動したら、この後、諸々わかりやすくするためにホスト名を変更します。
それぞれのラズパイで/etc/hostnameを編集してホスト名を以下のように変更し、rebootコマンドで再起動します。
| ホスト名 | ラズパイ |
|---|---|
| leader-01 | Raspberry Pi 4 |
| worker-01 | Raspberry Pi 3 |
| worker-02 | Raspberry Pi 3 |
今後の作業はsshして行なうため、hostname -Iコマンド等を使って、それぞれのIPも調べておきます。
僕の環境では以下のような対応付になりました。
| ホスト名 | ip |
|---|---|
| leader-01 | 192.168.13.5 |
| worker-01 | 192.168.13.2 |
| worker-02 | 192.168.13.3 |
これで、基本のところのセットアップは完了です。
クライアントツールのインストール
ThinkPadの方でクライアントツールをインストールしておきます。
インストールするのは以下のツールです。
kubectlのインストール
まずはkubectlをインストールします。
以下のコマンドを実行してください。
$ wget https://storage.googleapis.com/kubernetes-release/release/v1.21.0/bin/linux/amd64/kubectl
$ chmod +x kubectl
$ sudo mv kubectl /usr/local/bin/
これで、インストールはOKです。
ちなみに諸事上で、僕の環境ではkubectlはv1.20.5のものを使います。
$ kubectl version --client
Client Version: version.Info{Major:"1", Minor:"20", GitVersion:"v1.20.5", GitCommit:"6b1d87acf3c8253c123756b9e61dac642678305f", GitTreeState:"clean", BuildDate:"2021-03-18T01:10:43Z", GoVersion:"go1.15.8", Compiler:"gc", Platform:"linux/amd64"}
ドキュメントによるとkubectlは2つのバージョンがサポートされるようです。
cfssl、cfssljsonのインストール
cfsslとcfljsonはPKI(公開鍵暗号基盤)を構築するために利用します。
$ wget -q --show-progress --https-only --timestamping \
  https://storage.googleapis.com/kubernetes-the-hard-way/cfssl/1.4.1/linux/cfssl \
  https://storage.googleapis.com/kubernetes-the-hard-way/cfssl/1.4.1/linux/cfssljson

$ chmod +x cfssl cfssljson
正しくインストールができていれば以下のコマンドでそれぞれバージョンが表示されるはずです。
$ cfssl version
Version: 1.4.1
Runtime: go1.12.12

$ cfssljson --version
Version: 1.4.1
Runtime: go1.12.12
これでクライアントツールのインストールは完了です。
CAのプロビジョニングとTLS証明書の発行
etcd、kube-apiserver、kubelet、kube-proxyのコンポーネント間の通信で利用されるTSL証明書の作成などを行います。
CAのプロビジョンを行なうために、CAの設定ファイルを作成します。
cat > ca-config.json <<EOF
{
  "signing": {
    "default": {
      "expiry": "8760h"
    },
    "profiles": {
      "kubernetes": {
        "usages": ["signing", "key encipherment", "server auth", "client auth"],
        "expiry": "8760h"
      }
    }
  }
}
EOF
次に、CAのための証明書署名リクエストのJsonを作成します。
cat > ca-csr.json <<EOF
{
  "CN": "Kubernetes",
  "key": {
    "algo": "rsa",
    "size": 2048
  },
  "names": [
    {
      "C": "US",
      "L": "Portland",
      "O": "Kubernetes",
      "OU": "CA",
      "ST": "Oregon"
    }
  ]
}
EOF
そして、CSの証明書と秘密鍵を作成します。
$ cfssl gencert -initca ca-csr.json | cfssljson -bare ca
すると以下のファイルが作成されているのを確認します。
- ca-key.pem
- ca.pem
クライアントとサーバの証明書発行
Kubernetesの各コンポーネントとクライアント(adminユーザ)のための証明書を発行します。
Admin クライアントの証明書の発行
Adminクライアントのための証明書署名リクエストのJsonを作成します。
cat > admin-csr.json <<EOF
{
  "CN": "admin",
  "key": {
    "algo": "rsa",
    "size": 2048
  },
  "names": [
    {
      "C": "US",
      "L": "Portland",
      "O": "system:masters",
      "OU": "Kubernetes The Hard Way",
      "ST": "Oregon"
    }
  ]
}
EOF
cfssl gencertコマンドを用いて、Adminクライアントの秘密鍵と証明書を発行します。
$ cfssl gencert \
  -ca=ca.pem \
  -ca-key=ca-key.pem \
  -config=ca-config.json \
  -profile=kubernetes \
  admin-csr.json | cfssljson -bare admin
その際に前に使っているCAの証明書および秘密鍵を利用します。
実行すると以下のファイルが作成されているのを確認します。
- admin-key.pem
- admin.pem
kubeletの証明書の発行
Kubernetesはkubeletからのリクエストの認可を行なうためにNode Authorizerと呼ばれるような特別な認可モードを利用します(詳細はこちら)。
werkerノードがNode Authriozerのリクエストを発行するための証明書を作成します。
今回はwerkerノードが2つなので以下のコマンドで証明書を発行します。
$ cat > worker-01-csr.json <<EOF
{
  "CN": "system:node:worker-01",
  "key": {
    "algo": "rsa",
    "size": 2048
  },
  "names": [
    {
      "C": "US",
      "L": "Portland",
      "O": "system:nodes",
      "OU": "Kubernetes The Hard Way",
      "ST": "Oregon"
    }
  ]
}
EOF


$  cfssl gencert \
   -ca=ca.pem \
   -ca-key=ca-key.pem \
   -config=ca-config.json \
   -hostname=worker-01,192.168.13.2 \
   -profile=kubernetes \
   worker-01-csr.json | cfssljson -bare worker-01
ここで、Node Authriozerでリクエストを送るためには、system:node:worker-01のworker-01の部分はノードのホスト名にする必要があります。
同様のことをworker-02でも行います。worker-01の部分を単純置換してcfssl genecertコマンドの-hostnameオプションに渡すIPは 192.168.13.3になります(手元の環境でそれぞれのIPは確認してください)。
以下の4つのファイルができると思います。
- worker-01-key.pem
- worker-01.pem
- worker-02-key.pem
- worker-02.pem
Controller Managerの証明書の発行
kube-controller-managerにも証明書を発行します。
$ cat > kube-controller-manager-csr.json <<EOF
{
  "CN": "system:kube-controller-manager",
  "key": {
    "algo": "rsa",
    "size": 2048
  },
  "names": [
    {
      "C": "US",
      "L": "Portland",
      "O": "system:kube-controller-manager",
      "OU": "Kubernetes The Hard Way",
      "ST": "Oregon"
    }
  ]
}
EOF

$ cfssl gencert \
  -ca=ca.pem \
  -ca-key=ca-key.pem \
  -config=ca-config.json \
  -profile=kubernetes \
  kube-controller-manager-csr.json | cfssljson -bare kube-controller-manager
kube-proxyの証明書の発行
今までと同様の方法でkube-proxyにも証明書を発行します。
$ cat > kube-proxy-csr.json <<EOF
{
  "CN": "system:kube-proxy",
  "key": {
    "algo": "rsa",
    "size": 2048
  },
  "names": [
    {
      "C": "US",
      "L": "Portland",
      "O": "system:node-proxier",
      "OU": "Kubernetes The Hard Way",
      "ST": "Oregon"
    }
  ]
}
EOF

$ cfssl gencert \
  -ca=ca.pem \
  -ca-key=ca-key.pem \
  -config=ca-config.json \
  -profile=kubernetes \
  kube-proxy-csr.json | cfssljson -bare kube-proxy
以下のファイルが作成されます。
- kube-proxy-key.pem
- kube-proxy.pem
Scheduler Clientの証明書の発行
Schedulerの証明書を発行します。
$ cat > kube-scheduler-csr.json <<EOF
{
  "CN": "system:kube-scheduler",
  "key": {
    "algo": "rsa",
    "size": 2048
  },
  "names": [
    {
      "C": "US",
      "L": "Portland",
      "O": "system:kube-scheduler",
      "OU": "Kubernetes The Hard Way",
      "ST": "Oregon"
    }
  ]
}
EOF

$ cfssl gencert \
  -ca=ca.pem \
  -ca-key=ca-key.pem \
  -config=ca-config.json \
  -profile=kubernetes \
  kube-scheduler-csr.json | cfssljson -bare kube-scheduler
以下のファイルが作成されます。
- kube-scheduler-key.pem
- kube-scheduler.pem
Kubernetes APIサーバの証明書の発行
APIサーバの証明書を発行します。 APIサーバはleader-01にデプロイするため、IPなどは、そちらのものを利用します。
$ cat > kubernetes-csr.json <<EOF
{
  "CN": "kubernetes",
  "key": {
    "algo": "rsa",
    "size": 2048
  },
  "names": [
    {
      "C": "US",
      "L": "Portland",
      "O": "Kubernetes",
      "OU": "Kubernetes The Hard Way",
      "ST": "Oregon"
    }
  ]
}
EOF

$ export KUBERNETES_PUBLIC_ADDRESS=192.168.13.5

$ export KUBERNETES_HOSTNAMES=kubernetes,kubernetes.default,kubernetes.default.svc,kubernetes.default.svc.cluster,kubernetes.svc.cluster.local

$ cfssl gencert \
  -ca=ca.pem \
  -ca-key=ca-key.pem \
  -config=ca-config.json \
  -hostname=10.32.0.1,10.240.0.10,10.240.0.11,10.240.0.12,${KUBERNETES_PUBLIC_ADDRESS},127.0.0.1,${KUBERNETES_HOSTNAMES} \
  -profile=kubernetes \
  kubernetes-csr.json | cfssljson -bare kubernetes
次のファイルが作成されると思います。
- kubernetes-key.pem
- kubernetes.pem
Service Accountの証明書を発行します。
Service Accountの証明書を発行します。
$ cat > service-account-csr.json <<EOF
{
  "CN": "service-accounts",
  "key": {
    "algo": "rsa",
    "size": 2048
  },
  "names": [
    {
      "C": "US",
      "L": "Portland",
      "O": "Kubernetes",
      "OU": "Kubernetes The Hard Way",
      "ST": "Oregon"
    }
  ]
}
EOF


$ cfssl gencert \
  -ca=ca.pem \
  -ca-key=ca-key.pem \
  -config=ca-config.json \
  -profile=kubernetes \
  service-account-csr.json | cfssljson -bare service-account

}
作成した証明書のNodeへの配置
作成した証明書を各ノードに配置しておきます。
$ scp ca.pem ca-key.pem kubernetes.pem kubernetes-key.pem  ubuntu@192.168.13.5:~/

$ scp ca.pem ca-key.pem worker-01-key.pem worker-01.pem ubuntu@192.168.13.2:~/

$ scp ca.pem ca-key.pem worker-02-key.pem worker-02.pem ubuntu@192.168.13.3:~/
認証のためのkubeconfigsの作成
KubernetesクライアントがKubernetes API Serverを発見し、認証を行なうためのkubeconfigsファイルを作成する必要があります。
kubeconfigはkubelet、kube-proxy、scheduler、adminユーザ、controller manager用に作成します。
Kubeletのkubeconfigファイルを作成する
以下のコマンドでそれぞれのworker Nodeで動くkubeletのためのconfigファイルを作成します。
kubeletが正しく認可されるためにはkubeconfigファイルの作成にはNodeのホスト名を利用する必要があります。
また、KUBERNETES_PUBLIC_ADDRESSにはAPIサーバが動くノードのIPをセットしておきます(今回は前の工程ですでにexportしているのでそのまま利用します)。
$ for instance in worker-01 worker-02 ; do
  kubectl config set-cluster kubernetes-the-hard-way \
    --certificate-authority=ca.pem \
    --embed-certs=true \
    --server=https://${KUBERNETES_PUBLIC_ADDRESS}:6443 \
    --kubeconfig=${instance}.kubeconfig

  kubectl config set-credentials system:node:${instance} \
    --client-certificate=${instance}.pem \
    --client-key=${instance}-key.pem \
    --embed-certs=true \
    --kubeconfig=${instance}.kubeconfig

  kubectl config set-context default \
    --cluster=kubernetes-the-hard-way \
    --user=system:node:${instance} \
    --kubeconfig=${instance}.kubeconfig

  kubectl config use-context default --kubeconfig=${instance}.kubeconfig
done
以下のファイルが作成されたと思います。
- worker-01.kubeconfig
- worker-02.kubeconfig
kube-proxyのkubeconfigファイルを作成する
次はkube-proxyのファイルを作成します。
以下のコマンドを実行します。
$ kubectl config set-cluster kubernetes-the-hard-way \
    --certificate-authority=ca.pem \
    --embed-certs=true \
    --server=https://192.168.13.5:6443 \
    --kubeconfig=kube-proxy.kubeconfig

 $ kubectl config set-credentials system:kube-proxy \
    --client-certificate=kube-proxy.pem \
    --client-key=kube-proxy-key.pem \
    --embed-certs=true \
    --kubeconfig=kube-proxy.kubeconfig

 $ kubectl config set-context default \
    --cluster=kubernetes-the-hard-way \
    --user=system:kube-proxy \
    --kubeconfig=kube-proxy.kubeconfig

 $ kubectl config use-context default --kubeconfig=kube-proxy.kubeconfig
以下のファイルが作成されたと思います。
- kube-proxy.kubeconfig
kube-controller-managerのkubeconfigファイルを作成する
次はkube-controller-managerのファイルを作成します。
以下のコマンドを実行します。
$ kubectl config set-cluster kubernetes-the-hard-way \
    --certificate-authority=ca.pem \
    --embed-certs=true \
    --server=https://127.0.0.1:6443 \
    --kubeconfig=kube-controller-manager.kubeconfig

$ kubectl config set-credentials system:kube-controller-manager \
    --client-certificate=kube-controller-manager.pem \
    --client-key=kube-controller-manager-key.pem \
    --embed-certs=true \
    --kubeconfig=kube-controller-manager.kubeconfig

$ kubectl config set-context default \
    --cluster=kubernetes-the-hard-way \
    --user=system:kube-controller-manager \
    --kubeconfig=kube-controller-manager.kubeconfig

$ kubectl config use-context default --kubeconfig=kube-controller-manager.kubeconfig
以下のファイルが作成されたと思います。
- kube-controller-manager.kubeconfig
kube-scheduler.kubeconfigのkubeconfigファイルを作成する
次はkube-schedulerのファイルを作成します。
以下のコマンドを実行します。
$ kubectl config set-cluster kubernetes-the-hard-way \
    --certificate-authority=ca.pem \
    --embed-certs=true \
    --server=https://192.168.13.5:6443 \
    --kubeconfig=kube-scheduler.kubeconfig

$ kubectl config set-credentials system:kube-scheduler \
    --client-certificate=kube-scheduler.pem \
    --client-key=kube-scheduler-key.pem \
    --embed-certs=true \
    --kubeconfig=kube-scheduler.kubeconfig

$ kubectl config set-context default \
    --cluster=kubernetes-the-hard-way \
    --user=system:kube-scheduler \
    --kubeconfig=kube-scheduler.kubeconfig

$ kubectl config use-context default --kubeconfig=kube-scheduler.kubeconfig
以下のファイルが作成されました。
- kube-scheduler.kubeconfig
adminのkubeconfigファイルを作成する
次はadminのファイルを作成します。
以下のコマンドを実行します。
$ kubectl config set-cluster kubernetes-the-hard-way \
    --certificate-authority=ca.pem \
    --embed-certs=true \
    --server=https://127.0.0.1:6443 \
    --kubeconfig=admin.kubeconfig

$ kubectl config set-credentials admin \
    --client-certificate=admin.pem \
    --client-key=admin-key.pem \
    --embed-certs=true \
    --kubeconfig=admin.kubeconfig

$ kubectl config set-context default \
    --cluster=kubernetes-the-hard-way \
    --user=admin \
    --kubeconfig=admin.kubeconfig

$ kubectl config use-context default --kubeconfig=admin.kubeconfig
作成したkubeconfigのNodeへの配置
以下のコマンドを実行して、Nodeへkubeconfigへ配置します。
$ scp admin.kubeconfig kube-controller-manager.kubeconfig kube-scheduler.kubeconfig ubuntu@192.168.13.5:~/

$ scp worker-01.kubeconfig kube-proxy.kubeconfig ubuntu@192.168.13.2:~/

$ scp worker-02.kubeconfig kube-proxy.kubeconfig  ubuntu@192.168.13.3:~/
データ暗号化の設定と鍵を作成する
Kubernetesはクラスターの状態、アプリケーションコンフィグ、Sercretとなどの様々なデータをストアしています。
Kubernetesはクラスターのデータを利用されていないときに暗号化して保持する機能を持っています。
ここでは、暗号化の設定と鍵を作成します。
まずは暗号化するための鍵を作成します。
$ ENCRYPTION_KEY=$(head -c 32 /dev/urandom | base64)
次に設定ファイルを作成ます。
$ cat > encryption-config.yaml <<EOF
kind: EncryptionConfig
apiVersion: v1
resources:
  - resources:
      - secrets
    providers:
      - aescbc:
          keys:
            - name: key1
              secret: ${ENCRYPTION_KEY}
      - identity: {}
EOF
作ったencryption-config.yamlをleaderのNodeに配置します。
$ scp encryption-config.yaml ubuntu@192.168.13.5:~/
Bootstrapping the etcdの起動
諸々の設定ファルの作成とその配置ができたので、コンポーネントを起動していきます。
まずは、etcdからです。
etcdは分散型のkey-valueストアでKubernetesのすべてのクラスターの情報の保存場所として利用されています。
通常はクラスターを組むと思いますが、今回はleaderのNodeは1つのためひとつだけ起動します。
leaderのNodeにsshします。
$ ssh ubuntu@192.168.13.5
ログインに成功したらセットアップを行っていきます。
まずは、etcdのバイナリをダウンロードします。
$ wget -q --show-progress --https-only --timestamping   \
   "https://github.com/etcd-io/etcd/releases/download/v3.4.15/etcd-v3.4.15-linux-arm64.tar.gz"
cpuアーキテクチャはarm64を選択するように注意しましょう。
ダウンロードしたバイナリを回答して、/usr/local/binに配置します。
 $ tar -xvf etcd-v3.4.15-linux-arm64.tar.gz
 $ sudo mv etcd-v3.4.15-linux-arm64/etcd* /usr/local/bin/
etcdサーバのセットアップを行います。
$ sudo mkdir -p /etc/etcd /var/lib/etcd
$ sudo chmod 700 /var/lib/etcd
$ sudo cp ca.pem kubernetes-key.pem kubernetes.pem /etc/etcd/
systemdで管理するためにユニットファイルを作成します。
以下のコマンドを実行します。
cat <<EOF | sudo tee /etc/systemd/system/etcd.service
[Unit]
Description=etcd
Documentation=https://github.com/coreos

[Service]
Type=notify
ExecStart=/usr/local/bin/etcd \\
  --name leader-01 \\
  --cert-file=/etc/etcd/kubernetes.pem \\
  --key-file=/etc/etcd/kubernetes-key.pem \\
  --peer-cert-file=/etc/etcd/kubernetes.pem \\
  --peer-key-file=/etc/etcd/kubernetes-key.pem \\
  --trusted-ca-file=/etc/etcd/ca.pem \\
  --peer-trusted-ca-file=/etc/etcd/ca.pem \\
  --peer-client-cert-auth \\
  --client-cert-auth \\
  --initial-advertise-peer-urls https://192.168.13.5:2380 \\
  --listen-peer-urls https://192.168.13.5:2380 \\
  --listen-client-urls https://192.168.13.5:2379,https://127.0.0.1:2379 \\
  --advertise-client-urls https://192.168.13.5:2379 \\
  --initial-cluster-token etcd-cluster-0 \\
  --initial-cluster leader-01=https://192.168.13.5:2380 \\
  --initial-cluster-state new \\
  --data-dir=/var/lib/etcd
Restart=on-failure
RestartSec=5
Environment="ETCD_UNSUPPORTED_ARCH=arm64"

[Install]
WantedBy=multi-user.target
EOF
systemdでetcdを起動します。
$ sudo systemctl daemon-reload
$ sudo systemctl enable etcd
$ sudo systemctl start etcd
起動に成功していれば以下のコマンドでリストが取得できると思います。
$ sudo ETCDCTL_API=3 etcdctl member list \
  --endpoints=https://127.0.0.1:2379 \
  --cacert=/etc/etcd/ca.pem \
  --cert=/etc/etcd/kubernetes.pem \
  --key=/etc/etcd/kubernetes-key.pem

6ceeb31f89f1fb0d, started, leader-01, https://192.168.13.5:2380, https://192.168.13.5:2379, false
Kubernetes Control Planeの起動
Control Planeを起動しいきます。
Control Planeとは
- kube-apiserver
- KubernetesのAPIを外部に提供するコンポーネントです。Control Planeでのフロントエンドの役割を持っており、クライアントからのアクセスもコンポーネント間の通信も一度このAPI Serverrを経由するようになっています。
- kube-scheduler
- Podに対してNodeが割り当てられているか監視し、当てられていなかった場合はNodeの割当を行います。
- kube-controller-manager
コントロールプレーンの各コンポーネントのより詳細の情報に関してはこちらを確認ください。
バイナリダウンロードと配置
それではインストールしていきます。
etcd同様この作業もleaderのNodeで行います。
まずは、kubernetesの設定を配置するディレクトリを作成します。
$ sudo mkdir -p /etc/kubernetes/config
次にそれぞれのバイナリソースを取得します。
Control Planeとkubectlもインストールします。
wget -q --show-progress --https-only --timestamping \
  "https://storage.googleapis.com/kubernetes-release/release/v1.21.0/bin/linux/arm64/kube-apiserver" \
  "https://storage.googleapis.com/kubernetes-release/release/v1.21.0/bin/linux/arm64/kube-controller-manager" \
  "https://storage.googleapis.com/kubernetes-release/release/v1.21.0/bin/linux/arm64/kube-scheduler" \
  "https://storage.googleapis.com/kubernetes-release/release/v1.21.0/bin/linux/arm64/kubectl"
ダウンロードしたバイナリに実行権限を与え、適当なところに配置します。
$ chmod +x kube-apiserver kube-controller-manager kube-scheduler kubectl
$ sudo mv kube-apiserver kube-controller-manager kube-scheduler kubectl /usr/local/bin/
Kubernetes API Serverの設定を行なう
API Serverを設定していきます。
まずは証明書を配置するディレクトリを作成して、証明書をいどうさせます。
$ sudo mkdir -p /var/lib/kubernetes/

$ sudo mv ca.pem ca-key.pem kubernetes-key.pem kubernetes.pem \
   service-account-key.pem service-account.pem \
   encryption-config.yaml /var/lib/kubernetes/
API Serverをsystemdで起動したいので、ユニットファイルを作成します。
cat <<EOF | sudo tee /etc/systemd/system/kube-apiserver.service
[Unit]
Description=Kubernetes API Server
Documentation=https://github.com/kubernetes/kubernetes

[Service]
ExecStart=/usr/local/bin/kube-apiserver \\
  --advertise-address=192.168.13.5 \\
  --allow-privileged=true \\
  --apiserver-count=3 \\
  --audit-log-maxage=30 \\
  --audit-log-maxbackup=3 \\
  --audit-log-maxsize=100 \\
  --audit-log-path=/var/log/audit.log \\
  --authorization-mode=Node,RBAC \\
  --bind-address=0.0.0.0 \\
  --client-ca-file=/var/lib/kubernetes/ca.pem \\
  --enable-admission-plugins=NamespaceLifecycle,NodeRestriction,LimitRanger,ServiceAccount,DefaultStorageClass,ResourceQuota \\
  --etcd-cafile=/var/lib/kubernetes/ca.pem \\
  --etcd-certfile=/var/lib/kubernetes/kubernetes.pem \\
  --etcd-keyfile=/var/lib/kubernetes/kubernetes-key.pem \\
  --etcd-servers=https://127.0.0.1:2379 \\
  --event-ttl=1h \\
  --encryption-provider-config=/var/lib/kubernetes/encryption-config.yaml \\
  --kubelet-certificate-authority=/var/lib/kubernetes/ca.pem \\
  --kubelet-client-certificate=/var/lib/kubernetes/kubernetes.pem \\
  --kubelet-client-key=/var/lib/kubernetes/kubernetes-key.pem \\
  --runtime-config='api/all=true' \\
  --service-account-key-file=/var/lib/kubernetes/service-account.pem \\
  --service-account-signing-key-file=/var/lib/kubernetes/service-account-key.pem \\
  --service-account-issuer=https://192.168.13.5:6443 \\
  --service-cluster-ip-range=10.32.0.0/24 \\
  --service-node-port-range=30000-32767 \\
  --tls-cert-file=/var/lib/kubernetes/kubernetes.pem \\
  --tls-private-key-file=/var/lib/kubernetes/kubernetes-key.pem \\
  --v=2
Restart=on-failure
RestartSec=5

[Install]
WantedBy=multi-user.target
EOF
Kubernetes Controller Managerの設定を行なう
Controller Managerの設定を行っていきます。
kube-controller-manager.kubeconfigを/var/lib/kubernetesに配置します。
sudo mv kube-controller-manager.kubeconfig /var/lib/kubernetes/
Controller Managerのユニットファイルを作成します。
$ cat <<EOF | sudo tee /etc/systemd/system/kube-controller-manager.service
[Unit]
Description=Kubernetes Controller Manager
Documentation=https://github.com/kubernetes/kubernetes

[Service]
ExecStart=/usr/local/bin/kube-controller-manager \\
  --bind-address=0.0.0.0 \\
  --cluster-cidr=10.200.0.0/16 \\
  --cluster-name=kubernetes \\
  --cluster-signing-cert-file=/var/lib/kubernetes/ca.pem \\
  --cluster-signing-key-file=/var/lib/kubernetes/ca-key.pem \\
  --kubeconfig=/var/lib/kubernetes/kube-controller-manager.kubeconfig \\
  --leader-elect=true \\
  --root-ca-file=/var/lib/kubernetes/ca.pem \\
  --service-account-private-key-file=/var/lib/kubernetes/service-account-key.pem \\
  --service-cluster-ip-range=10.32.0.0/24 \\
  --use-service-account-credentials=true \\
  --v=2
Restart=on-failure
RestartSec=5

[Install]
WantedBy=multi-user.target
EOF
Kubernetes Schedulerの設定を行なう
Schedulerの設定を行っていきます。
kube-scheduler.kubeconfigを/var/lib/kubernetesに配置します。
$ sudo mv kube-scheduler.kubeconfig /var/lib/kubernetes/
次に、kube-scheduler.yamlを作成します。
$ sudo mkdir -p /etc/kubernetes/config/

$ cat <<EOF | sudo tee /etc/kubernetes/config/kube-scheduler.yaml
apiVersion: kubescheduler.config.k8s.io/v1beta1
kind: KubeSchedulerConfiguration
clientConnection:
  kubeconfig: "/var/lib/kubernetes/kube-scheduler.kubeconfig"
leaderElection:
  leaderElect: true
EOF
systemdのユニットファイルを作成します。
cat <<EOF | sudo tee /etc/systemd/system/kube-scheduler.service
[Unit]
Description=Kubernetes Scheduler
Documentation=https://github.com/kubernetes/kubernetes

[Service]
ExecStart=/usr/local/bin/kube-scheduler \\
  --config=/etc/kubernetes/config/kube-scheduler.yaml \\
  --v=2
Restart=on-failure
RestartSec=5

[Install]
WantedBy=multi-user.target
EOF
各Control Planeの起動
各コンポーネントのユニットファイルは作成したので、読み込んで起動します。
$ sudo systemctl daemon-reload
$ sudo systemctl enable kube-apiserver kube-controller-manager kube-scheduler
$ sudo systemctl start kube-apiserver kube-controller-manager kube-scheduler
起動が正常にできているか以下のコマンドで確認します。
$ kubectl cluster-info --kubeconfig admin.kubeconfig

Kubernetes control plane is running at https://127.0.0.1:6443
Kubernetes control plane is runningというのが出ていればOKっぽいです。
KubeletへのRBACの設定を行なう
API Serverが各Workerで動くKubeletへのアクセスをするためのRBACの設定を行います。
API Serverはメトリクスの収集、ログの取得、Pod内でのコマンド実行などのためにkubeletにアクセスします。
以下のコマンドを実行して、system:kube-apiserver-to-kubelet ClusterRoleを作成します。
$ cat <<EOF | kubectl apply --kubeconfig admin.kubeconfig -f -
apiVersion: rbac.authorization.k8s.io/v1
kind: ClusterRole
metadata:
  annotations:
    rbac.authorization.kubernetes.io/autoupdate: "true"
  labels:
    kubernetes.io/bootstrapping: rbac-defaults
  name: system:kube-apiserver-to-kubelet
rules:
  - apiGroups:
      - ""
    resources:
      - nodes/proxy
      - nodes/stats
      - nodes/log
      - nodes/spec
      - nodes/metrics
    verbs:
      - "*"
EOF
API ServerはKubuletにkubernetesユーザとして認証します。なので、先程作ったsystem:kube-apiserver-to-kubelet ClusterRoleをkubernetesユーザにバインドします。
cat <<EOF | kubectl apply --kubeconfig admin.kubeconfig -f -
apiVersion: rbac.authorization.k8s.io/v1
kind: ClusterRoleBinding
metadata:
  name: system:kube-apiserver
  namespace: ""
roleRef:
  apiGroup: rbac.authorization.k8s.io
  kind: ClusterRole
  name: system:kube-apiserver-to-kubelet
subjects:
  - apiGroup: rbac.authorization.k8s.io
    kind: User
    name: kubernetes
EOF
Worker Nodeの起動
2つのworker Nodeを起動します。
Worker Nodeでは以下のようなソフトウェアが起動します。
- runc
- OCI Specificationに沿って、コンテナの生成、実行を行なうCLIツール
- container networking plugins
- containerd
- 業界標準のコンテナランタイム
- kubelet
- 各ノードで動作する主要なNodeエージェント。API Serverにホスト名等を使ってNodeを登録する。PodSpecのセットを取得し、PodSpecに記載されているコンテナが正常に動作している状態を保証する
- kube-proxy
- 各ノードで動作するネットワークプロキシ。Nodeのネットワークルールをメンテナンスする。
Worker Nodeをプロビジョニングする
以下の操作は各Worker Nodeで実行します。なお、説明ではworker-01でセットアップを行い02のセットアップは省略しますが基本的に同じようなセットアップを行います(別途、別の操作が必要な場合は補足します)。
最初にworker-01にアクセスします。
$ ssh ubuntu@192.168.13.2
必要な依存を取得してきます。
$ sudo apt-get update
$ sudo apt-get -y install socat conntrack ipset
socatはkubectl port-forwardコマンドのサポートを行なうために必要なようです。
デフォルトではkubeletはswapが有効化されていると起動しません。
以下のコマンドを実行した際に出力がなにもなければswapは有効化されていません。
$ sudo swapon --show
もし、有効化されていた場合は以下のコマンドで、無効にしてください。
$ sudo swapoff -a
無効化が確認できたら、必要なバイナリをインストールします。
まずはバイナリをダウンロードします。
$ wget -q --show-progress --https-only --timestamping \
  https://github.com/kubernetes-sigs/cri-tools/releases/download/v1.21.0/crictl-v1.21.0-linux-arm64.tar.gz \
  https://github.com/containernetworking/plugins/releases/download/v0.9.1/cni-plugins-linux-arm64-v0.9.1.tgz \
  https://storage.googleapis.com/kubernetes-release/release/v1.21.0/bin/linux/arm64/kubectl \
  https://storage.googleapis.com/kubernetes-release/release/v1.21.0/bin/linux/arm64/kube-proxy \
  https://storage.googleapis.com/kubernetes-release/release/v1.21.0/bin/linux/arm64/kubelet
次に必要なディレクトリを作成しておきます。
$ sudo mkdir -p \
  /etc/cni/net.d \
  /opt/cni/bin \
  /var/lib/kubelet \
  /var/lib/kube-proxy \
  /var/lib/kubernetes \
  /var/run/kubernetes
バイナリを各ディレクトリに移動 or 解凍します。
$ tar -xvf crictl-v1.21.0-linux-arm64.tar.gz
$ sudo tar -xvf cni-plugins-linux-arm64-v0.9.1.tgz -C /opt/cni/bin/
$ chmod +x crictl kubectl kube-proxy kubelet
$ sudo mv crictl kubectl kube-proxy kubelet /usr/local/bin/
containerdとruncに関してはarm64アーキテクチャでのインストールにはひと工夫が必要です。
まず、containerdですが、このIssueによるとdownload.docker.comで提供されているものがあるみたいだったのでそちらを利用させていただこうと思います。
以下のコマンドでインストールします。
$ wget https://download.docker.com/linux/ubuntu/dists/focal/pool/test/arm64/containerd.io_1.4.3-2_arm64.deb
$ sudo apt install ./containerd.io_1.4.3-2_arm64.deb
$ containerd -v
containerd containerd.io 1.4.3 269548fa27e0089a8b8278fc4fc781d7f65a939b
続いて、runcですが、こちらは公式での提供が内容だったので(少なくとも僕が調べる限りでは)自分でビルドしようと思います。
ビルドは1番スペックがよいmaster-01で行って、実行ファイルをcspでそれぞれのworkerに配布しようと思います。
$ ssh ubuntu@192.168.13.5
まず、ビルドにはgo が必要なようなので、goのインストールを行います。
$ wget https://golang.org/dl/go1.16.3.linux-arm64.tar.gz
$ sudo rm -rf /usr/local/go && sudo tar -C /usr/local -xzf go1.16.3.linux-arm64.tar.gz
$ export PATH=$PATH:/usr/local/go/bin
$ go version
go version go1.16.3 linux/arm6
次にビルドに必要な依存をとってきます。
$ sudo apt install build-essential
$ sudo apt install pkg-config
$ sudo apt install -y libseccomp-dev
最後にソースコードを取得して、ビルドを行います。
$ git clone https://github.com/opencontainers/runc
$ cd runc
$ make
$ sudo make install
ビルドが完了したらできた実行ファイルをそれぞれのworkerに配布します。
$ scp /usr/local/sbin/runc ubuntu@192.168.13.2:~/
$ scp /usr/local/sbin/runc ubuntu@192.168.13.3:~/
それぞれのworkerで適当なディレクトリにruncを移動します。
$ sudo mv runc /usr/local/bin/
$ runc -v
runc version 1.0.0-rc93+dev
commit: 2965ffc7e327dc3dc33a9b308ba8396e60e5bb58
spec: 1.0.2-dev
go: go1.16.3
libseccomp: 2.4.3
(versionの指定をちゃんとしてなかったので、devがインストールされてしまってますね...一旦ここでは先に進みます)
CNIの設定を行なう
bridgeネットワークの設定ファイルを作成します。
$ cat <<EOF | sudo tee /etc/cni/net.d/10-bridge.conf
{
    "cniVersion": "0.4.0",
    "name": "bridge",
    "type": "bridge",
    "bridge": "cnio0",
    "isGateway": true,
    "ipMasq": true,
    "ipam": {
        "type": "host-local",
        "ranges": [
          [{"subnet": "10.200.0.0/24"}]
        ],
        "routes": [{"dst": "0.0.0.0/0"}]
    }
}
EOF
loopbackのネットワーク設定を記述します。
$ cat <<EOF | sudo tee /etc/cni/net.d/99-loopback.conf
{
    "cniVersion": "0.4.0",
    "name": "lo",
    "type": "loopback"
}
EOF
kubeletの設定を行なう
kubeletのための設定や証明書を必要なディレクトリに配置します。
$ sudo mv ${HOSTNAME}-key.pem ${HOSTNAME}.pem /var/lib/kubelet/
$ sudo mv ${HOSTNAME}.kubeconfig /var/lib/kubelet/kubeconfig
$ sudo mv ca.pem /var/lib/kubernetes/
kubelet-config.yamlを作成します。
$ cat <<EOF | sudo tee /var/lib/kubelet/kubelet-config.yaml
kind: KubeletConfiguration
apiVersion: kubelet.config.k8s.io/v1beta1
authentication:
  anonymous:
    enabled: false
  webhook:
    enabled: true
  x509:
    clientCAFile: "/var/lib/kubernetes/ca.pem"
authorization:
  mode: Webhook
clusterDomain: "cluster.local"
clusterDNS:
  - "10.32.0.10"
podCIDR: "10.200.0.0/24"
resolvConf: "/run/systemd/resolve/resolv.conf"
runtimeRequestTimeout: "15m"
tlsCertFile: "/var/lib/kubelet/${HOSTNAME}.pem"
tlsPrivateKeyFile: "/var/lib/kubelet/${HOSTNAME}-key.pem"
EOF
kubuletのユニットファイルを作成します。
cat <<EOF | sudo tee /etc/systemd/system/kubelet.service
[Unit]
Description=Kubernetes Kubelet
Documentation=https://github.com/kubernetes/kubernetes
After=containerd.service
Requires=containerd.service

[Service]
ExecStart=/usr/local/bin/kubelet \\
  --config=/var/lib/kubelet/kubelet-config.yaml \\
  --container-runtime=remote \\
  --container-runtime-endpoint=unix:///var/run/containerd/containerd.sock \\
  --image-pull-progress-deadline=2m \\
  --kubeconfig=/var/lib/kubelet/kubeconfig \\
  --network-plugin=cni \\
  --register-node=true \\
  --v=2
Restart=on-failure
RestartSec=5

[Install]
WantedBy=multi-user.target
EOF
containerdの設定を行なう
containerdの設定ファイルを作成します。
以下のコマンドを実行します。
cat << EOF | sudo tee /etc/containerd/config.toml
[plugins]
  [plugins.cri.containerd]
    snapshotter = "overlayfs"
    [plugins.cri.containerd.default_runtime]
      runtime_type = "io.containerd.runtime.v1.linux"
      runtime_engine = "/usr/local/bin/runc"
      runtime_root = ""
EOF
Kubernetes Proxyの設定を行なう
kube-proxyの設定を行います。
まずは、必要な設定ファイルを適当なディレクトリに配置します。
$ sudo mv kube-proxy.kubeconfig /var/lib/kube-proxy/kubeconfig
次にkube-proxy-config.yamlを作成します。
$ cat <<EOF | sudo tee /var/lib/kube-proxy/kube-proxy-config.yaml
kind: KubeProxyConfiguration
apiVersion: kubeproxy.config.k8s.io/v1alpha1
clientConnection:
  kubeconfig: "/var/lib/kube-proxy/kubeconfig"
mode: "iptables"
clusterCIDR: "10.200.0.0/16"
EOF
例のごとく、ユニットファイルを作成します。
cat <<EOF | sudo tee /etc/systemd/system/kube-proxy.service
[Unit]
Description=Kubernetes Kube Proxy
Documentation=https://github.com/kubernetes/kubernetes

[Service]
ExecStart=/usr/local/bin/kube-proxy \\
  --config=/var/lib/kube-proxy/kube-proxy-config.yaml
Restart=on-failure
RestartSec=5

[Install]
WantedBy=multi-user.target
EOF
各コンポーネントの起動
設定が完了したので、最後にコンポーネントを起動します。
以下のコマンドを実行します。
$ sudo systemctl daemon-reload
$ sudo systemctl enable containerd kubelet kube-proxy
$ sudo systemctl start containerd kubelet kube-proxy
正常に起動が完了すると、leader-01からNodeが認識されているのが確認できます。
$ kubectl get nodes --kubeconfig admin.kubeconfig
NAME        STATUS   ROLES    AGE     VERSION
worker-01   Ready    <none>   8m2s    v1.21.0
worker-02   Ready    <none>   8m59s   v1.21.0
リモートからkubectlでアクセスできるようにする
kubectlの設定を行って毎回--kubeconfig等でファイルを指定しなくても良いようにします。
ThinkPadのクライアントPCで以下のコマンドを実行します。
$ kubectl config set-cluster kubernetes-the-hard-way \
   --certificate-authority=ca.pem \
   --embed-certs=true \
   --server=https://192.168.13.5:6443

$ kubectl config set-credentials admin \
   --client-certificate=admin.pem \
   --client-key=admin-key.pem

$ kubectl config set-context kubernetes-the-hard-way \
   --cluster=kubernetes-the-hard-way \
   --user=admin

$ kubectl config use-context kubernetes-the-hard-way
kubectl get nodeでNodeの一覧を取得できるようになってます。
$ kubectl version
Client Version: version.Info{Major:"1", Minor:"20", GitVersion:"v1.20.5", GitCommit:"6b1d87acf3c8253c123756b9e61dac642678305f", GitTreeState:"clean", BuildDate:"2021-03-18T01:10:43Z", GoVersion:"go1.15.8", Compiler:"gc", Platform:"linux/amd64"}
Server Version: version.Info{Major:"1", Minor:"21", GitVersion:"v1.21.0", GitCommit:"cb303e613a121a29364f75cc67d3d580833a7479", GitTreeState:"clean", BuildDate:"2021-04-08T16:25:06Z", GoVersion:"go1.16.1", Compiler:"gc", Platform:"linux/arm64"}


$ kubectl get node
NAME        STATUS   ROLES    AGE   VERSION
worker-01   Ready    <none>   16m   v1.21.0
worker-02   Ready    <none>   17m   v1.21.0
Podネットワークルールのプロビジョニングを行なう
Pod間の通信を行なうためにflannelをクラスタにインストールします。
flannelはkubernetesのlayer 3でのネットワーク設定を行ってくれます。
$ kubectl apply -f https://raw.githubusercontent.com/coreos/flannel/master/Documentation/kube-flannel.yml
このあと失敗した
ここまでは、いろいろ苦難しつつもできたのですが、前述の通りflannelがうまく動かず失敗しました。
また、時間が立ってから再度やってみようと思います。
Raspberry pi 3 model b+にUbuntu18をインストールする
はじめに
Twitterとかでにk8sのクラスターをラズパイ上に構築しているのをよく見かけていたのですが、自分もGWでちょっとやってみようかと思い。
その仮定で、ラズパイにUbuntuをインストールする必要があるみたいなのでメモとして残しておこうと思います。
ラズパイを触るのは今回はじめてです。
やってみる
環境
Ubuntuをインストールするためのホストマシンの環境はこんな感じです。
$ lsb_release -a
LSB Version:    core-11.1.0ubuntu2-noarch:security-11.1.0ubuntu2-noarch
Distributor ID: Ubuntu
Description:    Ubuntu 20.04.2 LTS
Release:    20.04
Codename:   focal

$ uname -srvmpio
Linux 5.4.0-72-generic #80-Ubuntu SMP Mon Apr 12 17:35:00 UTC 2021 x86_64 x86_64 x86_64 GNU/Linux
そして、今回今回購入したのが以下の3つです。
- raspberry pi 3 model b+
- MicroSD 32GB
- micro USBコネクター

micro USBコネクター今回持ってなかったので購入しましたが、持っていれば買う必要はないです。
マウスやキーボードは自宅のすでに持っているものを追加います。
MicroSDとラズパイは秋葉原で購入しましたが大体2つで7千円弱ぐらいでした。
MircoSDにイメージを焼く
PCの組み込みMicroSDドライバーがあったので差し込みます。
MicroSDはmmcblk0という名前でマウントされるようです。
$ dmesg | grep mmcblk0
[    1.769416] mmcblk0: mmc0:5048 SD32G 28.9 GiB
[    1.788078]  mmcblk0: p1
次にイメージを焼いていくのですが、
Raspberry pi 3 model b+のBroadcom BCM2837B0, Cortex-A53はARMv8が蔡陽されたCPUのアーキテクチャのようで、ARM64のものを使えそうです。
wgetでイメージを取得して、ddコマンドでイメージを焼きます。
$ wget http://cdimage.ubuntu.com/releases/bionic/release/ubuntu-18.04.5-preinstalled-server-arm64+raspi3.img.xz

$  xzcat ubuntu-18.04.5-preinstalled-server-arm64+raspi3.img.xz | sudo dd bs=4M of=/dev/mmcblk0
0+318958 レコード入力
0+318958 レコード出力
2653289472 bytes (2.7 GB, 2.5 GiB) copied, 29.1715 s, 91.0 MB/s
これで、イメージを焼くことができました。
Ubuntuをインストールする
MiroiSDをPCの組み込みの読み込み機に差し込み、micro-usbでつないで電源を入れます。
ディスプレイをつなぐとUbuntunのインストールが自動的に始まり、パスワードの入力が求められます。
ここはubuntu/ubuntuと入力すると新しいパスワードの設定を求められるので任意のものを入れてください。
これでインストールは完了です。
JITWatchを動かしてみる
はじめに
ちょっと前のどこかのイベント(おそらくJJUG)でJitWatchというのが紹介されていて、ちょっと気になってました。
このブログではJITWatchを動かして見ようかと思います。
紹介動画とかみつつ、自分の理解をまとめています。正確な情報は公式のGitHub、紹介動画、スライド、Wiki等をご覧ください。
間違え等があればご指摘いただけると嬉しいです。
JitWatchとは
HotSpot JIT compilerのLogの解析と可視化を行なうためのツールです。
AdoptOpenJDKのプロジェクトで、Hotspotのログファイルを読み込んで、解析を実行することが可能なようです。
具体的には、以下のような機能を提供します。
- クラスツリーとどのメソッドがJITコンパイルされたか、いつコンパイルされたか、そしてコンパイルに関する情報のView機能
- ソースコード、バイトコード、アセンブリをそれぞれ対応付けして確認する
- JITコンパイルをプロットしていつコンパイルが行われたかを可視化する機能
- native methodsのサイズ、バイトコードのサイズ、コンパイルタイムのサイズなどのランキング機能
動かしてみる
環境
$ java --version
openjdk 11.0.10 2021-01-19
OpenJDK Runtime Environment 18.9 (build 11.0.10+9)
OpenJDK 64-Bit Server VM 18.9 (build 11.0.10+9, mixed mode)


$ mvn --version
Apache Maven 3.6.3
Maven home: /usr/share/maven
Java version: 11.0.10, vendor: Oracle Corporation, runtime: /home/someone/.sdkman/candidates/java/11.0.10-open
Default locale: ja_JP, platform encoding: UTF-8
OS name: "linux", version: "5.4.0-72-generic", arch: "amd64", family: "unix"
まずは起動してみる
インストールとJITWatchの起動は、GitHubからプロジェクトをクローンしてきて、Exec Maven Pluginの実行コマンド叩くだけでGUIが立ち上がります。
ただし、注意点としてJITWatchのGUIはJavaFXを利用するためもし含まれていないJDKを利用している場合はここの手順を参考にセットアップして利用するか、JDKを別のものに買えてください。
それでは、起動してみます。
$  git clone https://github.com/prometheus-operator/kube-prometheus.git

$ cd jitwatch

$ mvn clean compile test exec:java
実行すると以下のような画面が表示されます。

さくっと起動ができました。
Sandboxを動かしてみる
JITWatchの左上にsandbox文字が見れるのでおもむろに押してみます。
すると以下のようなエディターが立ち上がり、サンプルコードを実行できるようになっているみたいです。

Configure Sandboxの設定からクラスパス等を設定するといろいろできそうですが、一旦はこのままRunコマンドを実行してみます。
すると以下のようなウィンドウが起動され実行結果が出力されます。

これはTriViewと呼ばれるもので、実際のソースコードと対応するバイドコード、そしてアセンブリのコードが出力されるようになっているみたいです。
AssemblyのタブではAssembly not found. Was -XX:+PrintAssembly option used?という出力がされていますが、これはJITWatchがアセンブリコードを表示するためにいろいろ設定をしてやる必要があるからのようです。これらの設定等は後ほど補足しますが、ここではスルーします。
JITWatchを起動した際に、1番最初に表示された画面を確認してみると、少し表示が変わっているのがわかります。

ここでは、Compile Treeが表示されており、パッケージとそこに属するクラスを選択することができ、それぞれにメソッド対する解析結果を見ることができます。
画面上部にはTimeline、Histo、Toplist、Cacheなどのボタンが用意されていますが、このボタンを押すとそれぞれの解析結果を見れるようです。
先程表示されていた、TriViewも上部にあります。
主要なものの説明を以下にまとめます。
- Config: クラスパスなどの設定。
- Timeline: コンパイルのタイムライン
- Histo: コンパイル時間、メソッドサイズ、インラインメソッドサイズなどのヒストグラム
- Cache: 時間軸に対するコードキャッシュのフリースペース
- Threads: コンパイラのスレッドアクティビティ
- TriView: ソースコード、バイドコード、アセンブリのView
- Sugest: 予想が難しい分岐とホットメソットのインラインのサジェスト
ログを読み込んで解析を行なう
アプリの実行ログから解析を行ないます。
Spring BootのWebアプリを作成して、解析をしてみようと思います。
プロジェクトを作成して、hotspotのログを取得する
プロジェクトはSpring Initializrを使って、以下の設定で作成します。

作成したプロジェクトをダウンロードして解凍し以下のコントローラーひとつだけ作成しておきます。
@RestController
public class HelloController {

    Logger logger = LoggerFactory.getLogger(HelloController.class);

    @GetMapping("/hello")
    public String hello() {
        for (int i = 0; i < 1000; i++) logger.info(String.format("exec adjustNum %s times", adjustNum(i)));
        return "hello";
    }

    private int adjustNum(int a) {
        return a + 1;
    }
}
以下のコマンドでビルドします。
$ mvn clean package

$ ls target/
classes  demo-0.0.1-SNAPSHOT.jar  demo-0.0.1-SNAPSHOT.jar.original  generated-sources  generated-test-sources  maven-archiver  maven-status  surefire-reports  test-classes
jarができたので実行をします。
この際にJITWatchが必要とするログを出力するため以下のオプションを追加します。
- -XX:+UnlockDiagnosticVMOptions
- JDKの解析系のオプションをアンロックする
- -XX:+LogCompilation
- メソッドのコンパイルログを出力する
- -XX:+TraceClassLoading
- クラスロードされたクラスの追跡を有効にする
今回の場合は以下のように実行します。
$ java -XX:+UnlockDiagnosticVMOptions -XX:+LogCompilation -XX:+TraceClassLoading -jar target/demo-0.0.1-SNAPSHOT.jar
すると、hotsopt_pid[アプリケーションのpid].logという名前のログファイルが出力されます。
$ ls
HELP.md  demo.iml  hotspot_pid41577.log  mvnw  mvnw.cmd  pom.xml  src  target
今回の場合はhotspot_pid41577.logというのがそれですね。
JITWatchの設定を行なう
作成したログファイルをJITWatchに読み込ませますが、その前に以下のような設定をJITWatch側で行なう必要があります。
これらはJITWatchのConfig(最初に起動する画面上部の右から五番目あたり)から行なうことができます。
Config画面は以下のようになっています。
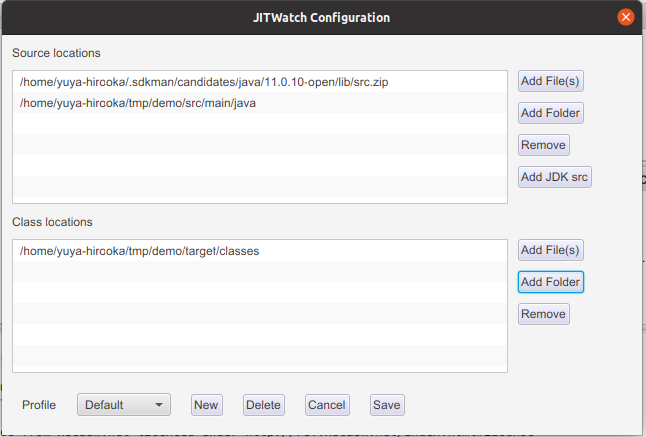
画面上部の段にはsrc.zipとアプリケーションのsrcデレクトリ、下の段にはクラスファイルのロケーションを指定します。
src.zipに関してはAdd JDK srcボタンを押すと(おそらくJITWatchを起動している)JDKのzipが自動的に設定され、その他の2つはAdd Folderで設定します。
この状態で、Open log から先程のログ読み込み、startボタンを押します。
すると以下のようにadjustNum()関数がC1コンパイルされたことが確認できます。

アセンブリコードの生成(補足)
今回は試しませんが、JITWatchのTriViewでは生成されたアセンブリのコードも見ることができます。
そのためにはhsdisをビルドして、JDKの適当なディレクトリ(8以前と以降で配置するディレクトリが違います)に配置し、プログラム実行時に-XX:+PrintAssemblyオプションを指定してやる必要があります。
詳細はここを確認してください。
感想
今回、Spring Bootのアプリの解析をやってみましあんまり意味は無かったかもしれません、ちなみにjarを適切に指定してやるとSpringのクラスの解析も行えそうでした。
KtorのアプリからMicrometer+PrometheusでJVMのメトリクスを取得する
はじめに
Ktorのドキュメント呼んでいたらMicrometerに対応してそうだというのを見かけてちょっと動かしてみようかと思います。
基本的にはドキュメントに書かれた流れを沿う感じでやろうかと思います。
あと、PrometheusはDockerを用いて起動します。
やってみる
環境
$ lsb_release -a
LSB Version:    core-11.1.0ubuntu2-noarch:security-11.1.0ubuntu2-noarch
Distributor ID: Ubuntu
Description:    Ubuntu 20.04.2 LTS
Release:        20.04
Codename:       focal

$ uname -srvmpio
Linux 5.4.0-72-generic #80-Ubuntu SMP Mon Apr 12 17:35:00 UTC 2021 x86_64 x86_64 x86_64 GNU/Linux


$ docker version
Client: Docker Engine - Community
 Version:           20.10.6
 API version:       1.41
 Go version:        go1.13.15
 Git commit:        370c289
 Built:             Fri Apr  9 22:47:17 2021
 OS/Arch:           linux/amd64
 Context:           default
 Experimental:      true

Server: Docker Engine - Community
 Engine:
  Version:          20.10.6
  API version:      1.41 (minimum version 1.12)
  Go version:       go1.13.15
  Git commit:       8728dd2
  Built:            Fri Apr  9 22:45:28 2021
  OS/Arch:          linux/amd64
  Experimental:     true
 containerd:
  Version:          1.4.4
  GitCommit:        05f951a3781f4f2c1911b05e61c160e9c30eaa8e
 runc:
  Version:          1.0.0-rc93
  GitCommit:        12644e614e25b05da6fd08a38ffa0cfe1903fdec
 docker-init:
  Version:          0.19.0
  GitCommit:        de40ad0


$ java --version
openjdk 16 2021-03-16
OpenJDK Runtime Environment (build 16+36-2231)
OpenJDK 64-Bit Server VM (build 16+36-2231, mixed mode, sharing)
プロジェクトの作成
プロジェクトはIntelliJのKtorプラグインを使って作成します。
設定は以下のようにします。
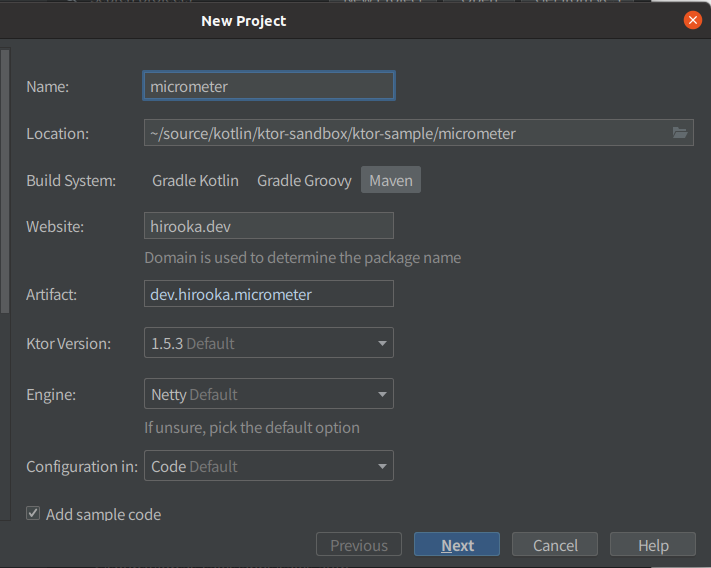
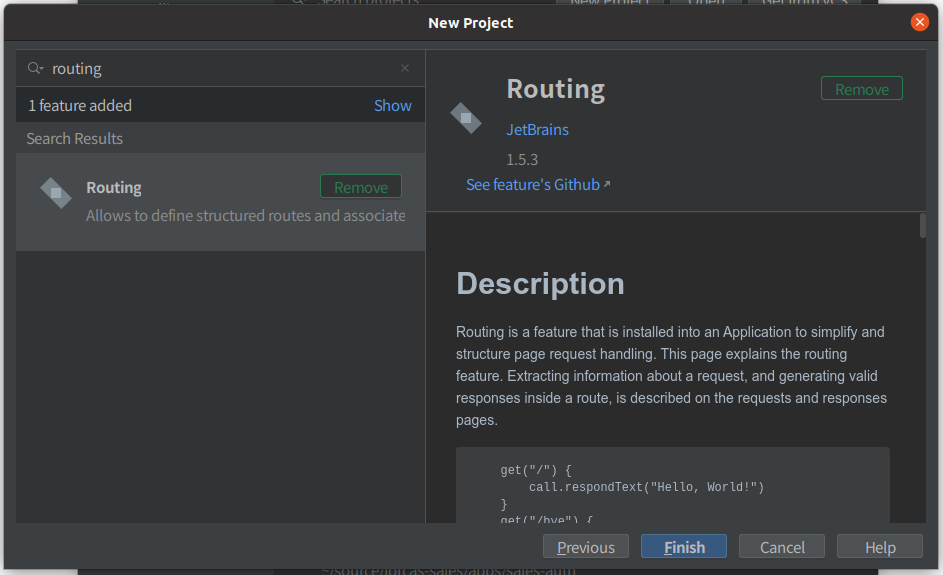
依存の追加のところでMicrometerを追加することもできますが、今回ははRoutingだけを選択します。
出来上がったプロジェクトのPomの抜粋を以下に示します。
    <properties>
        <ktor_version>1.5.3</ktor_version>
        <kotlin.code.style>official</kotlin.code.style>
        <kotlin_version>1.4.32</kotlin_version>
        <logback_version>1.2.3</logback_version>
        <project.build.sourceEncoding>UTF-8</project.build.sourceEncoding>
        <kotlin.compiler.incremental>true</kotlin.compiler.incremental>
        <main.class>hirooka.dev.ApplicationKt</main.class>
    </properties>
      <dependencies>
        <dependency>
            <groupId>io.ktor</groupId>
            <artifactId>ktor-server-core</artifactId>
            <version>${ktor_version}</version>
        </dependency>
        <dependency>
            <groupId>io.ktor</groupId>
            <artifactId>ktor-server-netty</artifactId>
            <version>${ktor_version}</version>
        </dependency>
        <dependency>
            <groupId>ch.qos.logback</groupId>
            <artifactId>logback-classic</artifactId>
            <version>${logback_version}</version>
        </dependency>
        <dependency>
            <groupId>io.ktor</groupId>
            <artifactId>ktor-server-tests</artifactId>
            <version>${ktor_version}</version>
            <scope>test</scope>
        </dependency>
    </dependencies>
Ktorのバージョンは1.4.32が選択されているのと、依存にはテスト関連の者Lockbackそして、ktor-server-coreが追加されていました。
Prometheus形式のメトリクスを取得できるようにする
まずは以下の依存をPomに追加する必要があります。
        <dependency>
            <groupId>io.ktor</groupId>
            <artifactId>ktor-metrics-micrometer</artifactId>
            <version>${ktor_version}</version>
        </dependency>
        <dependency>
            <groupId>io.micrometer</groupId>
            <artifactId>micrometer-registry-prometheus</artifactId>
            <version>1.6.6</version>
        </dependency>
1つ目はKtorのMicrometerのサポートを提供してくれるプロジェクトで、2つ目はPrometheusのレジストリーです。
次にApplication.ktを以下のように修正します。
import io.ktor.server.engine.*
import io.ktor.server.netty.*
import hirooka.dev.plugins.*
import io.ktor.application.*
import io.ktor.metrics.micrometer.*

fun main() {
    val prometheusMeterRegistry = PrometheusMeterRegistry(PrometheusConfig.DEFAULT)
    embeddedServer(Netty, port = 8080, host = "0.0.0.0") {
        install(MicrometerMetrics) {
            registry = prometheusMeterRegistry
        }
        configureRouting()
    }.start(wait = true)
}
追加したのはinstall(MicrometerMetrics)のところです。
KtorでMicromerを使う場合installでMicrometerMwetricsのクラスをインストールする必要があります。
次にJVMのメトリクスを公開するために更に以下のような修正をくわえます。
fun main() {
    val prometheusMeterRegistry = PrometheusMeterRegistry(PrometheusConfig.DEFAULT)
    embeddedServer(Netty, port = 8080, host = "0.0.0.0") {
        install(MicrometerMetrics) {
            registry = prometheusMeterRegistry

            meterBinders = listOf(
                JvmMemoryMetrics(),
                JvmGcMetrics(),
                ProcessorMetrics(),
            )
        }
        configureRouting()
    }.start(wait = true)
}
最後のProcessorMetrics()はシステムのメトリクスなので今回はいらないかもしれませんが一応追加しておきます。
最後に取得したメトリクスを公開するRoutingを記述します。
fun main() {
    val prometheusMeterRegistry = PrometheusMeterRegistry(PrometheusConfig.DEFAULT)
    embeddedServer(Netty, port = 8080, host = "0.0.0.0") {
        install(MicrometerMetrics) {
            registry = prometheusMeterRegistry
        }

        routing {
            get("/metrics") {
                call.respond(prometheusMeterRegistry.scrape())
            }
        }
        configureRouting()
    }.start(wait = true)
}
Mainの頭のところでイニシャライズしたprometheusMeterRegistryを使う必要があったため、今回はApplication.ktにRoutingを記述しました。
具体的には/metricsというPathに対してprometheusMeterRegistry.scrape()で取得できるメトリクスを返すようにしています。
これでアプリケーション側の設定は完了です。
アプリケーションを起動して、cURLでメトリクスを取得してみます。
$ curl localhost:8080/metrics
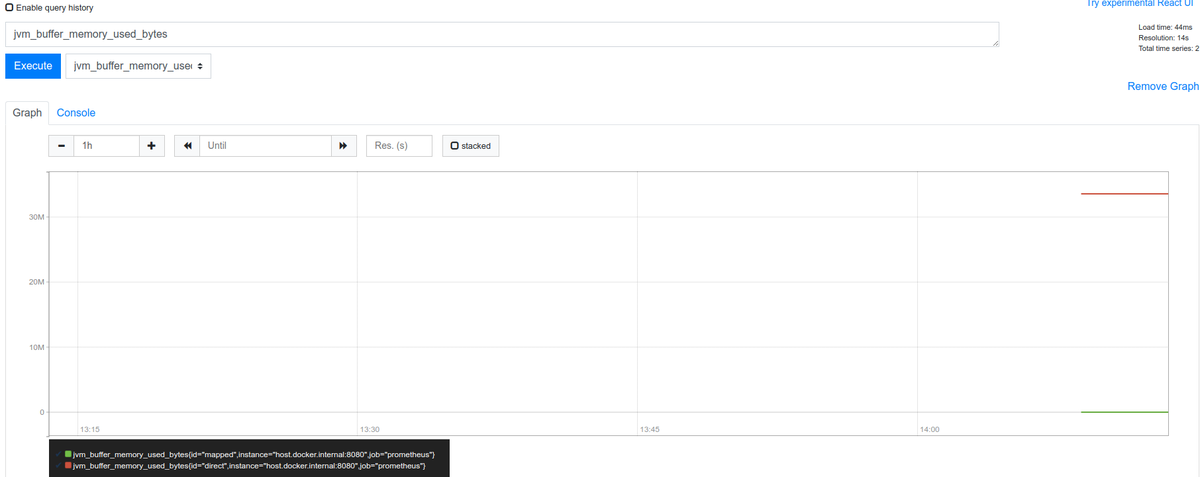
# HELP jvm_buffer_memory_used_bytes An estimate of the memory that the Java virtual machine is using for this buffer pool
# TYPE jvm_buffer_memory_used_bytes gauge
jvm_buffer_memory_used_bytes{id="mapped",} 0.0
jvm_buffer_memory_used_bytes{id="direct",} 3.3562632E7
# HELP system_cpu_usage The "recent cpu usage" for the whole system
# TYPE system_cpu_usage gauge
system_cpu_usage 0.06208306434258662
# HELP jvm_memory_max_bytes The maximum amount of memory in bytes that can be used for memory management
# TYPE jvm_memory_max_bytes gauge
jvm_memory_max_bytes{area="nonheap",id="CodeHeap 'profiled nmethods'",} 1.22908672E8
jvm_memory_max_bytes{area="heap",id="G1 Survivor Space",} -1.0
jvm_memory_max_bytes{area="heap",id="G1 Old Gen",} 8.321499136E9
jvm_memory_max_bytes{area="nonheap",id="Metaspace",} -1.0
jvm_memory_max_bytes{area="nonheap",id="CodeHeap 'non-nmethods'",} 5836800.0
jvm_memory_max_bytes{area="heap",id="G1 Eden Space",} -1.0
jvm_memory_max_bytes{area="nonheap",id="Compressed Class Space",} 1.073741824E9
jvm_memory_max_bytes{area="nonheap",id="CodeHeap 'non-profiled nmethods'",} 1.22912768E8
# HELP jvm_gc_pause_seconds Time spent in GC pause
# TYPE jvm_gc_pause_seconds summary
jvm_gc_pause_seconds_count{action="end of minor GC",cause="Metadata GC Threshold",} 1.0
jvm_gc_pause_seconds_sum{action="end of minor GC",cause="Metadata GC Threshold",} 0.006
# HELP jvm_gc_pause_seconds_max Time spent in GC pause
# TYPE jvm_gc_pause_seconds_max gauge
jvm_gc_pause_seconds_max{action="end of minor GC",cause="Metadata GC Threshold",} 0.006
# HELP jvm_gc_max_data_size_bytes Max size of long-lived heap memory pool
# TYPE jvm_gc_max_data_size_bytes gauge
jvm_gc_max_data_size_bytes 8.321499136E9
# HELP system_load_average_1m The sum of the number of runnable entities queued to available processors and the number of runnable entities running on the available processors averaged over a period of time
# TYPE system_load_average_1m gauge
system_load_average_1m 2.18
# HELP jvm_memory_committed_bytes The amount of memory in bytes that is committed for the Java virtual machine to use
# TYPE jvm_memory_committed_bytes gauge
jvm_memory_committed_bytes{area="nonheap",id="CodeHeap 'profiled nmethods'",} 2686976.0
jvm_memory_committed_bytes{area="heap",id="G1 Survivor Space",} 6291456.0
jvm_memory_committed_bytes{area="heap",id="G1 Old Gen",} 4.5088768E8
jvm_memory_committed_bytes{area="nonheap",id="Metaspace",} 2.5608192E7
jvm_memory_committed_bytes{area="nonheap",id="CodeHeap 'non-nmethods'",} 2555904.0
jvm_memory_committed_bytes{area="heap",id="G1 Eden Space",} 6.291456E7
jvm_memory_committed_bytes{area="nonheap",id="Compressed Class Space",} 2883584.0
jvm_memory_committed_bytes{area="nonheap",id="CodeHeap 'non-profiled nmethods'",} 2555904.0
# HELP jvm_buffer_total_capacity_bytes An estimate of the total capacity of the buffers in this pool
# TYPE jvm_buffer_total_capacity_bytes gauge
jvm_buffer_total_capacity_bytes{id="mapped",} 0.0
jvm_buffer_total_capacity_bytes{id="direct",} 3.3562631E7
# HELP system_cpu_count The number of processors available to the Java virtual machine
# TYPE system_cpu_count gauge
system_cpu_count 8.0
# HELP ktor_http_server_requests_seconds_max
# TYPE ktor_http_server_requests_seconds_max gauge
ktor_http_server_requests_seconds_max{address="localhost:8080",method="GET",route="/metrics",status="200",throwable="n/a",} 0.021426668
# HELP ktor_http_server_requests_seconds
# TYPE ktor_http_server_requests_seconds histogram
ktor_http_server_requests_seconds_bucket{address="localhost:8080",method="GET",route="/metrics",status="200",throwable="n/a",le="0.001",} 0.0
ktor_http_server_requests_seconds_bucket{address="localhost:8080",method="GET",route="/metrics",status="200",throwable="n/a",le="0.001048576",} 0.0
ktor_http_server_requests_seconds_bucket{address="localhost:8080",method="GET",route="/metrics",status="200",throwable="n/a",le="0.001398101",} 0.0
ktor_http_server_requests_seconds_bucket{address="localhost:8080",method="GET",route="/metrics",status="200",throwable="n/a",le="0.001747626",} 0.0
ktor_http_server_requests_seconds_bucket{address="localhost:8080",method="GET",route="/metrics",status="200",throwable="n/a",le="0.002097151",} 0.0
ktor_http_server_requests_seconds_bucket{address="localhost:8080",method="GET",route="/metrics",status="200",throwable="n/a",le="0.002446676",} 0.0
ktor_http_server_requests_seconds_bucket{address="localhost:8080",method="GET",route="/metrics",status="200",throwable="n/a",le="0.002796201",} 0.0
ktor_http_server_requests_seconds_bucket{address="localhost:8080",method="GET",route="/metrics",status="200",throwable="n/a",le="0.003145726",} 0.0
ktor_http_server_requests_seconds_bucket{address="localhost:8080",method="GET",route="/metrics",status="200",throwable="n/a",le="0.003495251",} 0.0
ktor_http_server_requests_seconds_bucket{address="localhost:8080",method="GET",route="/metrics",status="200",throwable="n/a",le="0.003844776",} 0.0
ktor_http_server_requests_seconds_bucket{address="localhost:8080",method="GET",route="/metrics",status="200",throwable="n/a",le="0.004194304",} 0.0
ktor_http_server_requests_seconds_bucket{address="localhost:8080",method="GET",route="/metrics",status="200",throwable="n/a",le="0.005592405",} 0.0
ktor_http_server_requests_seconds_bucket{address="localhost:8080",method="GET",route="/metrics",status="200",throwable="n/a",le="0.006990506",} 0.0
ktor_http_server_requests_seconds_bucket{address="localhost:8080",method="GET",route="/metrics",status="200",throwable="n/a",le="0.008388607",} 0.0
ktor_http_server_requests_seconds_bucket{address="localhost:8080",method="GET",route="/metrics",status="200",throwable="n/a",le="0.009786708",} 0.0
ktor_http_server_requests_seconds_bucket{address="localhost:8080",method="GET",route="/metrics",status="200",throwable="n/a",le="0.011184809",} 0.0
ktor_http_server_requests_seconds_bucket{address="localhost:8080",method="GET",route="/metrics",status="200",throwable="n/a",le="0.01258291",} 0.0
ktor_http_server_requests_seconds_bucket{address="localhost:8080",method="GET",route="/metrics",status="200",throwable="n/a",le="0.013981011",} 0.0
ktor_http_server_requests_seconds_bucket{address="localhost:8080",method="GET",route="/metrics",status="200",throwable="n/a",le="0.015379112",} 0.0
ktor_http_server_requests_seconds_bucket{address="localhost:8080",method="GET",route="/metrics",status="200",throwable="n/a",le="0.016777216",} 0.0
ktor_http_server_requests_seconds_bucket{address="localhost:8080",method="GET",route="/metrics",status="200",throwable="n/a",le="0.022369621",} 1.0
ktor_http_server_requests_seconds_bucket{address="localhost:8080",method="GET",route="/metrics",status="200",throwable="n/a",le="0.027962026",} 1.0
ktor_http_server_requests_seconds_bucket{address="localhost:8080",method="GET",route="/metrics",status="200",throwable="n/a",le="0.033554431",} 1.0
ktor_http_server_requests_seconds_bucket{address="localhost:8080",method="GET",route="/metrics",status="200",throwable="n/a",le="0.039146836",} 1.0
ktor_http_server_requests_seconds_bucket{address="localhost:8080",method="GET",route="/metrics",status="200",throwable="n/a",le="0.044739241",} 1.0
ktor_http_server_requests_seconds_bucket{address="localhost:8080",method="GET",route="/metrics",status="200",throwable="n/a",le="0.050331646",} 1.0
ktor_http_server_requests_seconds_bucket{address="localhost:8080",method="GET",route="/metrics",status="200",throwable="n/a",le="0.055924051",} 1.0
ktor_http_server_requests_seconds_bucket{address="localhost:8080",method="GET",route="/metrics",status="200",throwable="n/a",le="0.061516456",} 1.0
ktor_http_server_requests_seconds_bucket{address="localhost:8080",method="GET",route="/metrics",status="200",throwable="n/a",le="0.067108864",} 1.0
ktor_http_server_requests_seconds_bucket{address="localhost:8080",method="GET",route="/metrics",status="200",throwable="n/a",le="0.089478485",} 1.0
ktor_http_server_requests_seconds_bucket{address="localhost:8080",method="GET",route="/metrics",status="200",throwable="n/a",le="0.1",} 1.0
ktor_http_server_requests_seconds_bucket{address="localhost:8080",method="GET",route="/metrics",status="200",throwable="n/a",le="0.111848106",} 1.0
ktor_http_server_requests_seconds_bucket{address="localhost:8080",method="GET",route="/metrics",status="200",throwable="n/a",le="0.134217727",} 1.0
ktor_http_server_requests_seconds_bucket{address="localhost:8080",method="GET",route="/metrics",status="200",throwable="n/a",le="0.156587348",} 1.0
ktor_http_server_requests_seconds_bucket{address="localhost:8080",method="GET",route="/metrics",status="200",throwable="n/a",le="0.178956969",} 1.0
ktor_http_server_requests_seconds_bucket{address="localhost:8080",method="GET",route="/metrics",status="200",throwable="n/a",le="0.20132659",} 1.0
ktor_http_server_requests_seconds_bucket{address="localhost:8080",method="GET",route="/metrics",status="200",throwable="n/a",le="0.223696211",} 1.0
ktor_http_server_requests_seconds_bucket{address="localhost:8080",method="GET",route="/metrics",status="200",throwable="n/a",le="0.246065832",} 1.0
ktor_http_server_requests_seconds_bucket{address="localhost:8080",method="GET",route="/metrics",status="200",throwable="n/a",le="0.268435456",} 1.0
ktor_http_server_requests_seconds_bucket{address="localhost:8080",method="GET",route="/metrics",status="200",throwable="n/a",le="0.357913941",} 1.0
ktor_http_server_requests_seconds_bucket{address="localhost:8080",method="GET",route="/metrics",status="200",throwable="n/a",le="0.447392426",} 1.0
ktor_http_server_requests_seconds_bucket{address="localhost:8080",method="GET",route="/metrics",status="200",throwable="n/a",le="0.5",} 1.0
ktor_http_server_requests_seconds_bucket{address="localhost:8080",method="GET",route="/metrics",status="200",throwable="n/a",le="0.536870911",} 1.0
ktor_http_server_requests_seconds_bucket{address="localhost:8080",method="GET",route="/metrics",status="200",throwable="n/a",le="0.626349396",} 1.0
ktor_http_server_requests_seconds_bucket{address="localhost:8080",method="GET",route="/metrics",status="200",throwable="n/a",le="0.715827881",} 1.0
ktor_http_server_requests_seconds_bucket{address="localhost:8080",method="GET",route="/metrics",status="200",throwable="n/a",le="0.805306366",} 1.0
ktor_http_server_requests_seconds_bucket{address="localhost:8080",method="GET",route="/metrics",status="200",throwable="n/a",le="0.894784851",} 1.0
ktor_http_server_requests_seconds_bucket{address="localhost:8080",method="GET",route="/metrics",status="200",throwable="n/a",le="0.984263336",} 1.0
ktor_http_server_requests_seconds_bucket{address="localhost:8080",method="GET",route="/metrics",status="200",throwable="n/a",le="1.073741824",} 1.0
ktor_http_server_requests_seconds_bucket{address="localhost:8080",method="GET",route="/metrics",status="200",throwable="n/a",le="1.431655765",} 1.0
ktor_http_server_requests_seconds_bucket{address="localhost:8080",method="GET",route="/metrics",status="200",throwable="n/a",le="1.789569706",} 1.0
ktor_http_server_requests_seconds_bucket{address="localhost:8080",method="GET",route="/metrics",status="200",throwable="n/a",le="2.147483647",} 1.0
ktor_http_server_requests_seconds_bucket{address="localhost:8080",method="GET",route="/metrics",status="200",throwable="n/a",le="2.505397588",} 1.0
ktor_http_server_requests_seconds_bucket{address="localhost:8080",method="GET",route="/metrics",status="200",throwable="n/a",le="2.863311529",} 1.0
ktor_http_server_requests_seconds_bucket{address="localhost:8080",method="GET",route="/metrics",status="200",throwable="n/a",le="3.22122547",} 1.0
ktor_http_server_requests_seconds_bucket{address="localhost:8080",method="GET",route="/metrics",status="200",throwable="n/a",le="3.579139411",} 1.0
ktor_http_server_requests_seconds_bucket{address="localhost:8080",method="GET",route="/metrics",status="200",throwable="n/a",le="3.937053352",} 1.0
ktor_http_server_requests_seconds_bucket{address="localhost:8080",method="GET",route="/metrics",status="200",throwable="n/a",le="4.294967296",} 1.0
ktor_http_server_requests_seconds_bucket{address="localhost:8080",method="GET",route="/metrics",status="200",throwable="n/a",le="5.726623061",} 1.0
ktor_http_server_requests_seconds_bucket{address="localhost:8080",method="GET",route="/metrics",status="200",throwable="n/a",le="7.158278826",} 1.0
ktor_http_server_requests_seconds_bucket{address="localhost:8080",method="GET",route="/metrics",status="200",throwable="n/a",le="8.589934591",} 1.0
ktor_http_server_requests_seconds_bucket{address="localhost:8080",method="GET",route="/metrics",status="200",throwable="n/a",le="10.021590356",} 1.0
ktor_http_server_requests_seconds_bucket{address="localhost:8080",method="GET",route="/metrics",status="200",throwable="n/a",le="11.453246121",} 1.0
ktor_http_server_requests_seconds_bucket{address="localhost:8080",method="GET",route="/metrics",status="200",throwable="n/a",le="12.884901886",} 1.0
ktor_http_server_requests_seconds_bucket{address="localhost:8080",method="GET",route="/metrics",status="200",throwable="n/a",le="14.316557651",} 1.0
ktor_http_server_requests_seconds_bucket{address="localhost:8080",method="GET",route="/metrics",status="200",throwable="n/a",le="15.748213416",} 1.0
ktor_http_server_requests_seconds_bucket{address="localhost:8080",method="GET",route="/metrics",status="200",throwable="n/a",le="17.179869184",} 1.0
ktor_http_server_requests_seconds_bucket{address="localhost:8080",method="GET",route="/metrics",status="200",throwable="n/a",le="20.0",} 1.0
ktor_http_server_requests_seconds_bucket{address="localhost:8080",method="GET",route="/metrics",status="200",throwable="n/a",le="+Inf",} 1.0
ktor_http_server_requests_seconds_count{address="localhost:8080",method="GET",route="/metrics",status="200",throwable="n/a",} 1.0
ktor_http_server_requests_seconds_sum{address="localhost:8080",method="GET",route="/metrics",status="200",throwable="n/a",} 0.021426668
# HELP ktor_http_server_requests_active
# TYPE ktor_http_server_requests_active gauge
ktor_http_server_requests_active 1.0
# HELP jvm_buffer_count_buffers An estimate of the number of buffers in the pool
# TYPE jvm_buffer_count_buffers gauge
jvm_buffer_count_buffers{id="mapped",} 0.0
jvm_buffer_count_buffers{id="direct",} 6.0
# HELP jvm_memory_used_bytes The amount of used memory
# TYPE jvm_memory_used_bytes gauge
jvm_memory_used_bytes{area="nonheap",id="CodeHeap 'profiled nmethods'",} 2629376.0
jvm_memory_used_bytes{area="heap",id="G1 Survivor Space",} 6291456.0
jvm_memory_used_bytes{area="heap",id="G1 Old Gen",} 0.0
jvm_memory_used_bytes{area="nonheap",id="Metaspace",} 2.4776112E7
jvm_memory_used_bytes{area="nonheap",id="CodeHeap 'non-nmethods'",} 1170432.0
jvm_memory_used_bytes{area="heap",id="G1 Eden Space",} 1.2582912E7
jvm_memory_used_bytes{area="nonheap",id="Compressed Class Space",} 2673248.0
jvm_memory_used_bytes{area="nonheap",id="CodeHeap 'non-profiled nmethods'",} 507008.0
# HELP jvm_gc_live_data_size_bytes Size of long-lived heap memory pool after reclamation
# TYPE jvm_gc_live_data_size_bytes gauge
jvm_gc_live_data_size_bytes 0.0
# HELP process_cpu_usage The "recent cpu usage" for the Java Virtual Machine process
# TYPE process_cpu_usage gauge
process_cpu_usage 9.6815834767642E-4
# HELP jvm_gc_memory_allocated_bytes_total Incremented for an increase in the size of the (young) heap memory pool after one GC to before the next
# TYPE jvm_gc_memory_allocated_bytes_total counter
jvm_gc_memory_allocated_bytes_total 2.3068672E7
# HELP jvm_gc_memory_promoted_bytes_total Count of positive increases in the size of the old generation memory pool before GC to after GC
# TYPE jvm_gc_memory_promoted_bytes_total counter
jvm_gc_memory_promoted_bytes_total 0.0
Promehteusから収集する
最後に公開されているメトリクスをPrometheus側から取得したいと思います。
まずは
global:
  scrape_interval:     15s
  evaluation_interval: 15s

rule_files:

scrape_configs:
  - job_name: prometheus
    static_configs:
      - targets: ['host.docker.internal:8080/metric']
余談ですがDocker 20.10系からLinuxで--add-host=host.docker.internal:host-gatewayみたいな感じで起動時にオプションを渡してやるとhost.docker.internalでホストマシンにアクセスできるようになったみたいですね。
PrometheusをDockerで起動します。この際に上記の設定ファイルをマウントするようにします。
docker run \
    --add-host=host.docker.internal:host-gateway \
    -p 9090:9090 \
    -v /path/to/four/config/prometheus.yml:/etc/prometheus/prometheus.yml \
    prom/prometheus
これでPrometheusが起動し、localhost:9090でUIに接続できます。
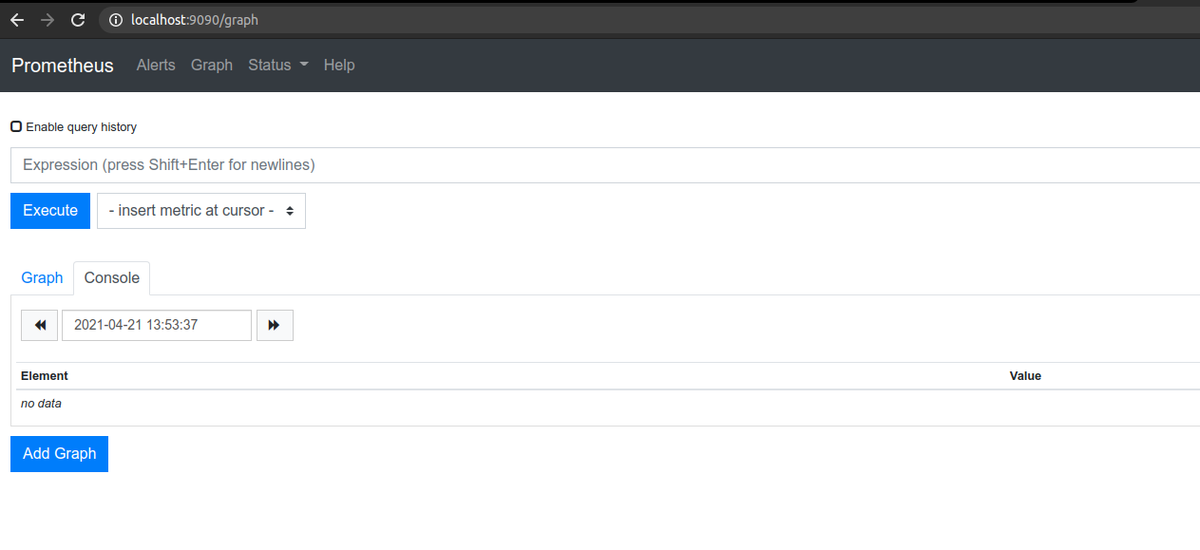
ターゲットの一覧を確認するときちんとアプリが認識されているのがわかります。
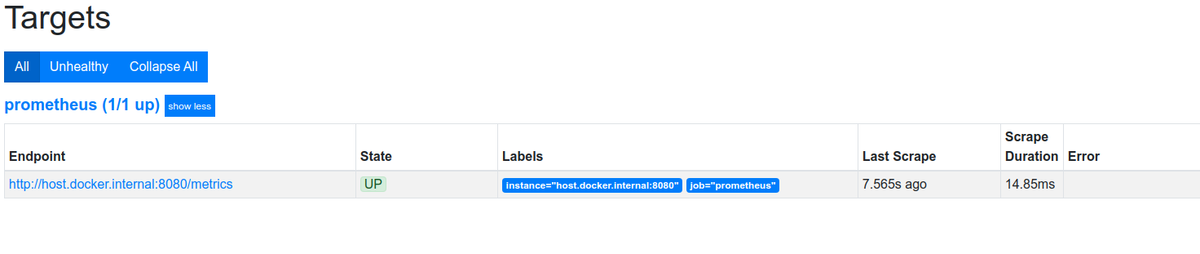
以下のようにjvm_buffer_count_buffersも可視化できました。