Raspberry pi 3 model b+にUbuntu18をインストールする
はじめに
Twitterとかでにk8sのクラスターをラズパイ上に構築しているのをよく見かけていたのですが、自分もGWでちょっとやってみようかと思い。
その仮定で、ラズパイにUbuntuをインストールする必要があるみたいなのでメモとして残しておこうと思います。
ラズパイを触るのは今回はじめてです。
やってみる
環境
Ubuntuをインストールするためのホストマシンの環境はこんな感じです。
$ lsb_release -a
LSB Version:    core-11.1.0ubuntu2-noarch:security-11.1.0ubuntu2-noarch
Distributor ID: Ubuntu
Description:    Ubuntu 20.04.2 LTS
Release:    20.04
Codename:   focal

$ uname -srvmpio
Linux 5.4.0-72-generic #80-Ubuntu SMP Mon Apr 12 17:35:00 UTC 2021 x86_64 x86_64 x86_64 GNU/Linux
そして、今回今回購入したのが以下の3つです。
- raspberry pi 3 model b+
- MicroSD 32GB
- micro USBコネクター

micro USBコネクター今回持ってなかったので購入しましたが、持っていれば買う必要はないです。
マウスやキーボードは自宅のすでに持っているものを追加います。
MicroSDとラズパイは秋葉原で購入しましたが大体2つで7千円弱ぐらいでした。
MircoSDにイメージを焼く
PCの組み込みMicroSDドライバーがあったので差し込みます。
MicroSDはmmcblk0という名前でマウントされるようです。
$ dmesg | grep mmcblk0
[    1.769416] mmcblk0: mmc0:5048 SD32G 28.9 GiB
[    1.788078]  mmcblk0: p1
次にイメージを焼いていくのですが、
Raspberry pi 3 model b+のBroadcom BCM2837B0, Cortex-A53はARMv8が蔡陽されたCPUのアーキテクチャのようで、ARM64のものを使えそうです。
wgetでイメージを取得して、ddコマンドでイメージを焼きます。
$ wget http://cdimage.ubuntu.com/releases/bionic/release/ubuntu-18.04.5-preinstalled-server-arm64+raspi3.img.xz

$  xzcat ubuntu-18.04.5-preinstalled-server-arm64+raspi3.img.xz | sudo dd bs=4M of=/dev/mmcblk0
0+318958 レコード入力
0+318958 レコード出力
2653289472 bytes (2.7 GB, 2.5 GiB) copied, 29.1715 s, 91.0 MB/s
これで、イメージを焼くことができました。
Ubuntuをインストールする
MiroiSDをPCの組み込みの読み込み機に差し込み、micro-usbでつないで電源を入れます。
ディスプレイをつなぐとUbuntunのインストールが自動的に始まり、パスワードの入力が求められます。
ここはubuntu/ubuntuと入力すると新しいパスワードの設定を求められるので任意のものを入れてください。
これでインストールは完了です。
JITWatchを動かしてみる
はじめに
ちょっと前のどこかのイベント(おそらくJJUG)でJitWatchというのが紹介されていて、ちょっと気になってました。
このブログではJITWatchを動かして見ようかと思います。
紹介動画とかみつつ、自分の理解をまとめています。正確な情報は公式のGitHub、紹介動画、スライド、Wiki等をご覧ください。
間違え等があればご指摘いただけると嬉しいです。
JitWatchとは
HotSpot JIT compilerのLogの解析と可視化を行なうためのツールです。
AdoptOpenJDKのプロジェクトで、Hotspotのログファイルを読み込んで、解析を実行することが可能なようです。
具体的には、以下のような機能を提供します。
- クラスツリーとどのメソッドがJITコンパイルされたか、いつコンパイルされたか、そしてコンパイルに関する情報のView機能
- ソースコード、バイトコード、アセンブリをそれぞれ対応付けして確認する
- JITコンパイルをプロットしていつコンパイルが行われたかを可視化する機能
- native methodsのサイズ、バイトコードのサイズ、コンパイルタイムのサイズなどのランキング機能
動かしてみる
環境
$ java --version
openjdk 11.0.10 2021-01-19
OpenJDK Runtime Environment 18.9 (build 11.0.10+9)
OpenJDK 64-Bit Server VM 18.9 (build 11.0.10+9, mixed mode)


$ mvn --version
Apache Maven 3.6.3
Maven home: /usr/share/maven
Java version: 11.0.10, vendor: Oracle Corporation, runtime: /home/someone/.sdkman/candidates/java/11.0.10-open
Default locale: ja_JP, platform encoding: UTF-8
OS name: "linux", version: "5.4.0-72-generic", arch: "amd64", family: "unix"
まずは起動してみる
インストールとJITWatchの起動は、GitHubからプロジェクトをクローンしてきて、Exec Maven Pluginの実行コマンド叩くだけでGUIが立ち上がります。
ただし、注意点としてJITWatchのGUIはJavaFXを利用するためもし含まれていないJDKを利用している場合はここの手順を参考にセットアップして利用するか、JDKを別のものに買えてください。
それでは、起動してみます。
$  git clone https://github.com/prometheus-operator/kube-prometheus.git

$ cd jitwatch

$ mvn clean compile test exec:java
実行すると以下のような画面が表示されます。

さくっと起動ができました。
Sandboxを動かしてみる
JITWatchの左上にsandbox文字が見れるのでおもむろに押してみます。
すると以下のようなエディターが立ち上がり、サンプルコードを実行できるようになっているみたいです。

Configure Sandboxの設定からクラスパス等を設定するといろいろできそうですが、一旦はこのままRunコマンドを実行してみます。
すると以下のようなウィンドウが起動され実行結果が出力されます。

これはTriViewと呼ばれるもので、実際のソースコードと対応するバイドコード、そしてアセンブリのコードが出力されるようになっているみたいです。
AssemblyのタブではAssembly not found. Was -XX:+PrintAssembly option used?という出力がされていますが、これはJITWatchがアセンブリコードを表示するためにいろいろ設定をしてやる必要があるからのようです。これらの設定等は後ほど補足しますが、ここではスルーします。
JITWatchを起動した際に、1番最初に表示された画面を確認してみると、少し表示が変わっているのがわかります。

ここでは、Compile Treeが表示されており、パッケージとそこに属するクラスを選択することができ、それぞれにメソッド対する解析結果を見ることができます。
画面上部にはTimeline、Histo、Toplist、Cacheなどのボタンが用意されていますが、このボタンを押すとそれぞれの解析結果を見れるようです。
先程表示されていた、TriViewも上部にあります。
主要なものの説明を以下にまとめます。
- Config: クラスパスなどの設定。
- Timeline: コンパイルのタイムライン
- Histo: コンパイル時間、メソッドサイズ、インラインメソッドサイズなどのヒストグラム
- Cache: 時間軸に対するコードキャッシュのフリースペース
- Threads: コンパイラのスレッドアクティビティ
- TriView: ソースコード、バイドコード、アセンブリのView
- Sugest: 予想が難しい分岐とホットメソットのインラインのサジェスト
ログを読み込んで解析を行なう
アプリの実行ログから解析を行ないます。
Spring BootのWebアプリを作成して、解析をしてみようと思います。
プロジェクトを作成して、hotspotのログを取得する
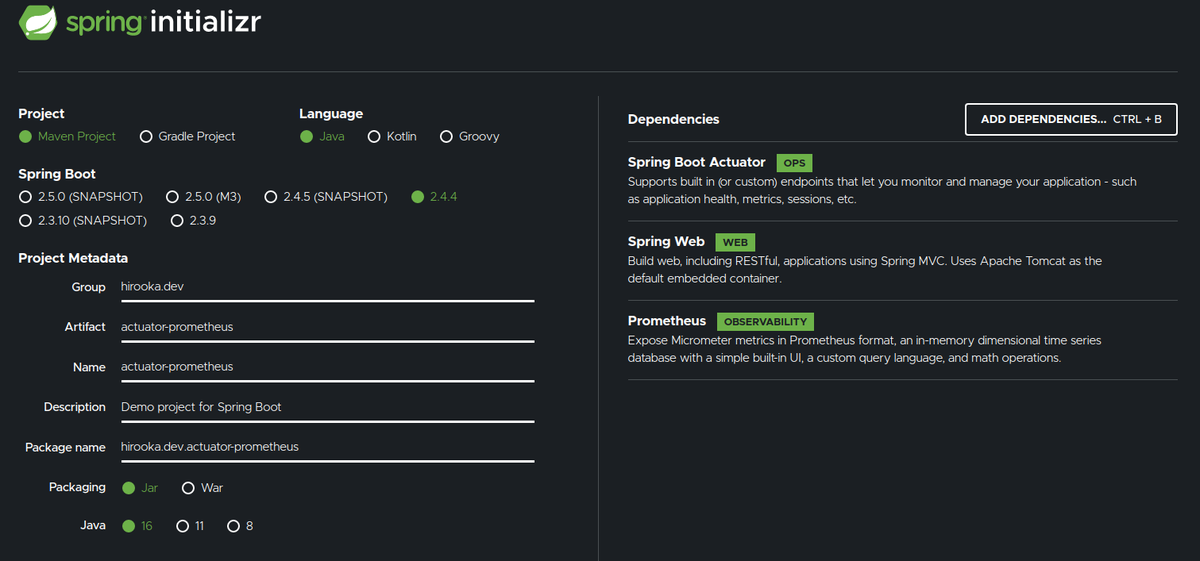
プロジェクトはSpring Initializrを使って、以下の設定で作成します。

作成したプロジェクトをダウンロードして解凍し以下のコントローラーひとつだけ作成しておきます。
@RestController
public class HelloController {

    Logger logger = LoggerFactory.getLogger(HelloController.class);

    @GetMapping("/hello")
    public String hello() {
        for (int i = 0; i < 1000; i++) logger.info(String.format("exec adjustNum %s times", adjustNum(i)));
        return "hello";
    }

    private int adjustNum(int a) {
        return a + 1;
    }
}
以下のコマンドでビルドします。
$ mvn clean package

$ ls target/
classes  demo-0.0.1-SNAPSHOT.jar  demo-0.0.1-SNAPSHOT.jar.original  generated-sources  generated-test-sources  maven-archiver  maven-status  surefire-reports  test-classes
jarができたので実行をします。
この際にJITWatchが必要とするログを出力するため以下のオプションを追加します。
- -XX:+UnlockDiagnosticVMOptions
- JDKの解析系のオプションをアンロックする
- -XX:+LogCompilation
- メソッドのコンパイルログを出力する
- -XX:+TraceClassLoading
- クラスロードされたクラスの追跡を有効にする
今回の場合は以下のように実行します。
$ java -XX:+UnlockDiagnosticVMOptions -XX:+LogCompilation -XX:+TraceClassLoading -jar target/demo-0.0.1-SNAPSHOT.jar
すると、hotsopt_pid[アプリケーションのpid].logという名前のログファイルが出力されます。
$ ls
HELP.md  demo.iml  hotspot_pid41577.log  mvnw  mvnw.cmd  pom.xml  src  target
今回の場合はhotspot_pid41577.logというのがそれですね。
JITWatchの設定を行なう
作成したログファイルをJITWatchに読み込ませますが、その前に以下のような設定をJITWatch側で行なう必要があります。
これらはJITWatchのConfig(最初に起動する画面上部の右から五番目あたり)から行なうことができます。
Config画面は以下のようになっています。
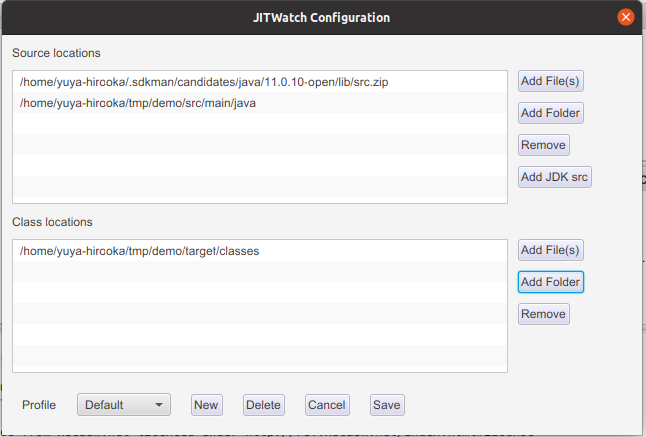
画面上部の段にはsrc.zipとアプリケーションのsrcデレクトリ、下の段にはクラスファイルのロケーションを指定します。
src.zipに関してはAdd JDK srcボタンを押すと(おそらくJITWatchを起動している)JDKのzipが自動的に設定され、その他の2つはAdd Folderで設定します。
この状態で、Open log から先程のログ読み込み、startボタンを押します。
すると以下のようにadjustNum()関数がC1コンパイルされたことが確認できます。

アセンブリコードの生成(補足)
今回は試しませんが、JITWatchのTriViewでは生成されたアセンブリのコードも見ることができます。
そのためにはhsdisをビルドして、JDKの適当なディレクトリ(8以前と以降で配置するディレクトリが違います)に配置し、プログラム実行時に-XX:+PrintAssemblyオプションを指定してやる必要があります。
詳細はここを確認してください。
感想
今回、Spring Bootのアプリの解析をやってみましあんまり意味は無かったかもしれません、ちなみにjarを適切に指定してやるとSpringのクラスの解析も行えそうでした。
KtorのアプリからMicrometer+PrometheusでJVMのメトリクスを取得する
はじめに
Ktorのドキュメント呼んでいたらMicrometerに対応してそうだというのを見かけてちょっと動かしてみようかと思います。
基本的にはドキュメントに書かれた流れを沿う感じでやろうかと思います。
あと、PrometheusはDockerを用いて起動します。
やってみる
環境
$ lsb_release -a
LSB Version:    core-11.1.0ubuntu2-noarch:security-11.1.0ubuntu2-noarch
Distributor ID: Ubuntu
Description:    Ubuntu 20.04.2 LTS
Release:        20.04
Codename:       focal

$ uname -srvmpio
Linux 5.4.0-72-generic #80-Ubuntu SMP Mon Apr 12 17:35:00 UTC 2021 x86_64 x86_64 x86_64 GNU/Linux


$ docker version
Client: Docker Engine - Community
 Version:           20.10.6
 API version:       1.41
 Go version:        go1.13.15
 Git commit:        370c289
 Built:             Fri Apr  9 22:47:17 2021
 OS/Arch:           linux/amd64
 Context:           default
 Experimental:      true

Server: Docker Engine - Community
 Engine:
  Version:          20.10.6
  API version:      1.41 (minimum version 1.12)
  Go version:       go1.13.15
  Git commit:       8728dd2
  Built:            Fri Apr  9 22:45:28 2021
  OS/Arch:          linux/amd64
  Experimental:     true
 containerd:
  Version:          1.4.4
  GitCommit:        05f951a3781f4f2c1911b05e61c160e9c30eaa8e
 runc:
  Version:          1.0.0-rc93
  GitCommit:        12644e614e25b05da6fd08a38ffa0cfe1903fdec
 docker-init:
  Version:          0.19.0
  GitCommit:        de40ad0


$ java --version
openjdk 16 2021-03-16
OpenJDK Runtime Environment (build 16+36-2231)
OpenJDK 64-Bit Server VM (build 16+36-2231, mixed mode, sharing)
プロジェクトの作成
プロジェクトはIntelliJのKtorプラグインを使って作成します。
設定は以下のようにします。
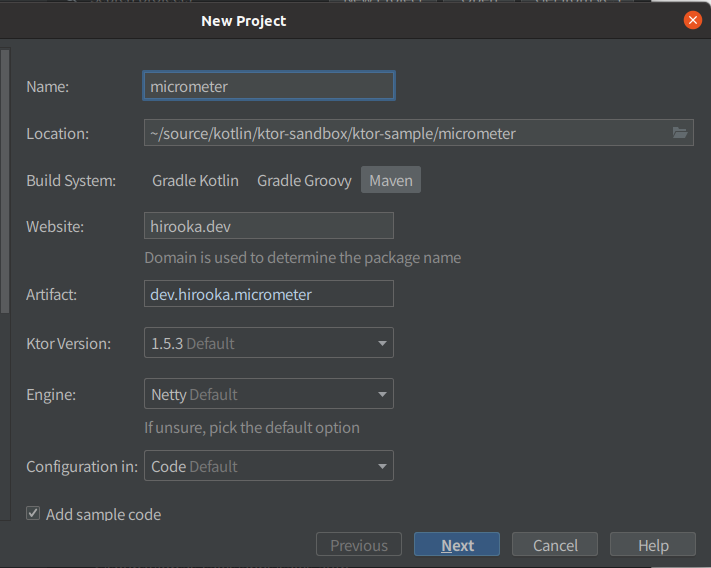
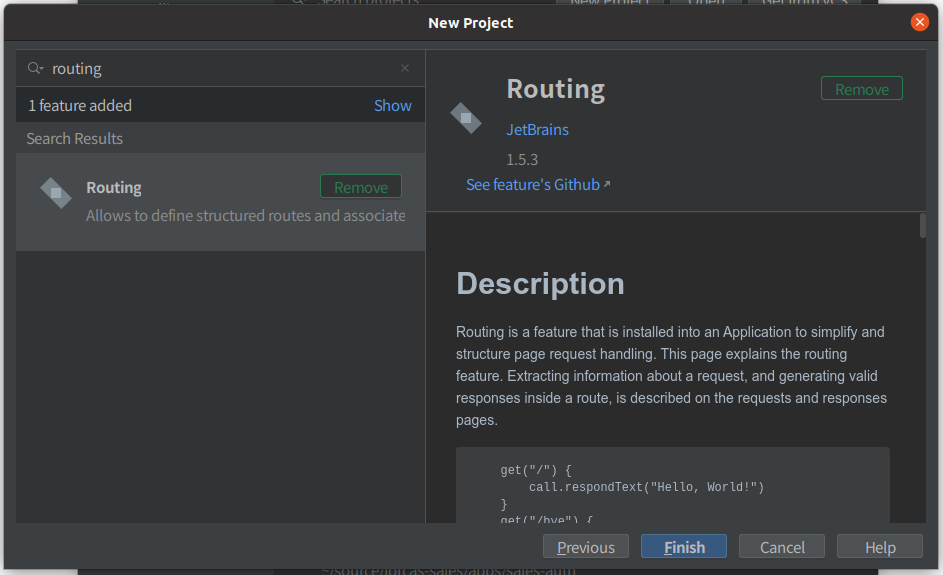
依存の追加のところでMicrometerを追加することもできますが、今回ははRoutingだけを選択します。
出来上がったプロジェクトのPomの抜粋を以下に示します。
    <properties>
        <ktor_version>1.5.3</ktor_version>
        <kotlin.code.style>official</kotlin.code.style>
        <kotlin_version>1.4.32</kotlin_version>
        <logback_version>1.2.3</logback_version>
        <project.build.sourceEncoding>UTF-8</project.build.sourceEncoding>
        <kotlin.compiler.incremental>true</kotlin.compiler.incremental>
        <main.class>hirooka.dev.ApplicationKt</main.class>
    </properties>
      <dependencies>
        <dependency>
            <groupId>io.ktor</groupId>
            <artifactId>ktor-server-core</artifactId>
            <version>${ktor_version}</version>
        </dependency>
        <dependency>
            <groupId>io.ktor</groupId>
            <artifactId>ktor-server-netty</artifactId>
            <version>${ktor_version}</version>
        </dependency>
        <dependency>
            <groupId>ch.qos.logback</groupId>
            <artifactId>logback-classic</artifactId>
            <version>${logback_version}</version>
        </dependency>
        <dependency>
            <groupId>io.ktor</groupId>
            <artifactId>ktor-server-tests</artifactId>
            <version>${ktor_version}</version>
            <scope>test</scope>
        </dependency>
    </dependencies>
Ktorのバージョンは1.4.32が選択されているのと、依存にはテスト関連の者Lockbackそして、ktor-server-coreが追加されていました。
Prometheus形式のメトリクスを取得できるようにする
まずは以下の依存をPomに追加する必要があります。
        <dependency>
            <groupId>io.ktor</groupId>
            <artifactId>ktor-metrics-micrometer</artifactId>
            <version>${ktor_version}</version>
        </dependency>
        <dependency>
            <groupId>io.micrometer</groupId>
            <artifactId>micrometer-registry-prometheus</artifactId>
            <version>1.6.6</version>
        </dependency>
1つ目はKtorのMicrometerのサポートを提供してくれるプロジェクトで、2つ目はPrometheusのレジストリーです。
次にApplication.ktを以下のように修正します。
import io.ktor.server.engine.*
import io.ktor.server.netty.*
import hirooka.dev.plugins.*
import io.ktor.application.*
import io.ktor.metrics.micrometer.*

fun main() {
    val prometheusMeterRegistry = PrometheusMeterRegistry(PrometheusConfig.DEFAULT)
    embeddedServer(Netty, port = 8080, host = "0.0.0.0") {
        install(MicrometerMetrics) {
            registry = prometheusMeterRegistry
        }
        configureRouting()
    }.start(wait = true)
}
追加したのはinstall(MicrometerMetrics)のところです。
KtorでMicromerを使う場合installでMicrometerMwetricsのクラスをインストールする必要があります。
次にJVMのメトリクスを公開するために更に以下のような修正をくわえます。
fun main() {
    val prometheusMeterRegistry = PrometheusMeterRegistry(PrometheusConfig.DEFAULT)
    embeddedServer(Netty, port = 8080, host = "0.0.0.0") {
        install(MicrometerMetrics) {
            registry = prometheusMeterRegistry

            meterBinders = listOf(
                JvmMemoryMetrics(),
                JvmGcMetrics(),
                ProcessorMetrics(),
            )
        }
        configureRouting()
    }.start(wait = true)
}
最後のProcessorMetrics()はシステムのメトリクスなので今回はいらないかもしれませんが一応追加しておきます。
最後に取得したメトリクスを公開するRoutingを記述します。
fun main() {
    val prometheusMeterRegistry = PrometheusMeterRegistry(PrometheusConfig.DEFAULT)
    embeddedServer(Netty, port = 8080, host = "0.0.0.0") {
        install(MicrometerMetrics) {
            registry = prometheusMeterRegistry
        }

        routing {
            get("/metrics") {
                call.respond(prometheusMeterRegistry.scrape())
            }
        }
        configureRouting()
    }.start(wait = true)
}
Mainの頭のところでイニシャライズしたprometheusMeterRegistryを使う必要があったため、今回はApplication.ktにRoutingを記述しました。
具体的には/metricsというPathに対してprometheusMeterRegistry.scrape()で取得できるメトリクスを返すようにしています。
これでアプリケーション側の設定は完了です。
アプリケーションを起動して、cURLでメトリクスを取得してみます。
$ curl localhost:8080/metrics
# HELP jvm_buffer_memory_used_bytes An estimate of the memory that the Java virtual machine is using for this buffer pool
# TYPE jvm_buffer_memory_used_bytes gauge
jvm_buffer_memory_used_bytes{id="mapped",} 0.0
jvm_buffer_memory_used_bytes{id="direct",} 3.3562632E7
# HELP system_cpu_usage The "recent cpu usage" for the whole system
# TYPE system_cpu_usage gauge
system_cpu_usage 0.06208306434258662
# HELP jvm_memory_max_bytes The maximum amount of memory in bytes that can be used for memory management
# TYPE jvm_memory_max_bytes gauge
jvm_memory_max_bytes{area="nonheap",id="CodeHeap 'profiled nmethods'",} 1.22908672E8
jvm_memory_max_bytes{area="heap",id="G1 Survivor Space",} -1.0
jvm_memory_max_bytes{area="heap",id="G1 Old Gen",} 8.321499136E9
jvm_memory_max_bytes{area="nonheap",id="Metaspace",} -1.0
jvm_memory_max_bytes{area="nonheap",id="CodeHeap 'non-nmethods'",} 5836800.0
jvm_memory_max_bytes{area="heap",id="G1 Eden Space",} -1.0
jvm_memory_max_bytes{area="nonheap",id="Compressed Class Space",} 1.073741824E9
jvm_memory_max_bytes{area="nonheap",id="CodeHeap 'non-profiled nmethods'",} 1.22912768E8
# HELP jvm_gc_pause_seconds Time spent in GC pause
# TYPE jvm_gc_pause_seconds summary
jvm_gc_pause_seconds_count{action="end of minor GC",cause="Metadata GC Threshold",} 1.0
jvm_gc_pause_seconds_sum{action="end of minor GC",cause="Metadata GC Threshold",} 0.006
# HELP jvm_gc_pause_seconds_max Time spent in GC pause
# TYPE jvm_gc_pause_seconds_max gauge
jvm_gc_pause_seconds_max{action="end of minor GC",cause="Metadata GC Threshold",} 0.006
# HELP jvm_gc_max_data_size_bytes Max size of long-lived heap memory pool
# TYPE jvm_gc_max_data_size_bytes gauge
jvm_gc_max_data_size_bytes 8.321499136E9
# HELP system_load_average_1m The sum of the number of runnable entities queued to available processors and the number of runnable entities running on the available processors averaged over a period of time
# TYPE system_load_average_1m gauge
system_load_average_1m 2.18
# HELP jvm_memory_committed_bytes The amount of memory in bytes that is committed for the Java virtual machine to use
# TYPE jvm_memory_committed_bytes gauge
jvm_memory_committed_bytes{area="nonheap",id="CodeHeap 'profiled nmethods'",} 2686976.0
jvm_memory_committed_bytes{area="heap",id="G1 Survivor Space",} 6291456.0
jvm_memory_committed_bytes{area="heap",id="G1 Old Gen",} 4.5088768E8
jvm_memory_committed_bytes{area="nonheap",id="Metaspace",} 2.5608192E7
jvm_memory_committed_bytes{area="nonheap",id="CodeHeap 'non-nmethods'",} 2555904.0
jvm_memory_committed_bytes{area="heap",id="G1 Eden Space",} 6.291456E7
jvm_memory_committed_bytes{area="nonheap",id="Compressed Class Space",} 2883584.0
jvm_memory_committed_bytes{area="nonheap",id="CodeHeap 'non-profiled nmethods'",} 2555904.0
# HELP jvm_buffer_total_capacity_bytes An estimate of the total capacity of the buffers in this pool
# TYPE jvm_buffer_total_capacity_bytes gauge
jvm_buffer_total_capacity_bytes{id="mapped",} 0.0
jvm_buffer_total_capacity_bytes{id="direct",} 3.3562631E7
# HELP system_cpu_count The number of processors available to the Java virtual machine
# TYPE system_cpu_count gauge
system_cpu_count 8.0
# HELP ktor_http_server_requests_seconds_max
# TYPE ktor_http_server_requests_seconds_max gauge
ktor_http_server_requests_seconds_max{address="localhost:8080",method="GET",route="/metrics",status="200",throwable="n/a",} 0.021426668
# HELP ktor_http_server_requests_seconds
# TYPE ktor_http_server_requests_seconds histogram
ktor_http_server_requests_seconds_bucket{address="localhost:8080",method="GET",route="/metrics",status="200",throwable="n/a",le="0.001",} 0.0
ktor_http_server_requests_seconds_bucket{address="localhost:8080",method="GET",route="/metrics",status="200",throwable="n/a",le="0.001048576",} 0.0
ktor_http_server_requests_seconds_bucket{address="localhost:8080",method="GET",route="/metrics",status="200",throwable="n/a",le="0.001398101",} 0.0
ktor_http_server_requests_seconds_bucket{address="localhost:8080",method="GET",route="/metrics",status="200",throwable="n/a",le="0.001747626",} 0.0
ktor_http_server_requests_seconds_bucket{address="localhost:8080",method="GET",route="/metrics",status="200",throwable="n/a",le="0.002097151",} 0.0
ktor_http_server_requests_seconds_bucket{address="localhost:8080",method="GET",route="/metrics",status="200",throwable="n/a",le="0.002446676",} 0.0
ktor_http_server_requests_seconds_bucket{address="localhost:8080",method="GET",route="/metrics",status="200",throwable="n/a",le="0.002796201",} 0.0
ktor_http_server_requests_seconds_bucket{address="localhost:8080",method="GET",route="/metrics",status="200",throwable="n/a",le="0.003145726",} 0.0
ktor_http_server_requests_seconds_bucket{address="localhost:8080",method="GET",route="/metrics",status="200",throwable="n/a",le="0.003495251",} 0.0
ktor_http_server_requests_seconds_bucket{address="localhost:8080",method="GET",route="/metrics",status="200",throwable="n/a",le="0.003844776",} 0.0
ktor_http_server_requests_seconds_bucket{address="localhost:8080",method="GET",route="/metrics",status="200",throwable="n/a",le="0.004194304",} 0.0
ktor_http_server_requests_seconds_bucket{address="localhost:8080",method="GET",route="/metrics",status="200",throwable="n/a",le="0.005592405",} 0.0
ktor_http_server_requests_seconds_bucket{address="localhost:8080",method="GET",route="/metrics",status="200",throwable="n/a",le="0.006990506",} 0.0
ktor_http_server_requests_seconds_bucket{address="localhost:8080",method="GET",route="/metrics",status="200",throwable="n/a",le="0.008388607",} 0.0
ktor_http_server_requests_seconds_bucket{address="localhost:8080",method="GET",route="/metrics",status="200",throwable="n/a",le="0.009786708",} 0.0
ktor_http_server_requests_seconds_bucket{address="localhost:8080",method="GET",route="/metrics",status="200",throwable="n/a",le="0.011184809",} 0.0
ktor_http_server_requests_seconds_bucket{address="localhost:8080",method="GET",route="/metrics",status="200",throwable="n/a",le="0.01258291",} 0.0
ktor_http_server_requests_seconds_bucket{address="localhost:8080",method="GET",route="/metrics",status="200",throwable="n/a",le="0.013981011",} 0.0
ktor_http_server_requests_seconds_bucket{address="localhost:8080",method="GET",route="/metrics",status="200",throwable="n/a",le="0.015379112",} 0.0
ktor_http_server_requests_seconds_bucket{address="localhost:8080",method="GET",route="/metrics",status="200",throwable="n/a",le="0.016777216",} 0.0
ktor_http_server_requests_seconds_bucket{address="localhost:8080",method="GET",route="/metrics",status="200",throwable="n/a",le="0.022369621",} 1.0
ktor_http_server_requests_seconds_bucket{address="localhost:8080",method="GET",route="/metrics",status="200",throwable="n/a",le="0.027962026",} 1.0
ktor_http_server_requests_seconds_bucket{address="localhost:8080",method="GET",route="/metrics",status="200",throwable="n/a",le="0.033554431",} 1.0
ktor_http_server_requests_seconds_bucket{address="localhost:8080",method="GET",route="/metrics",status="200",throwable="n/a",le="0.039146836",} 1.0
ktor_http_server_requests_seconds_bucket{address="localhost:8080",method="GET",route="/metrics",status="200",throwable="n/a",le="0.044739241",} 1.0
ktor_http_server_requests_seconds_bucket{address="localhost:8080",method="GET",route="/metrics",status="200",throwable="n/a",le="0.050331646",} 1.0
ktor_http_server_requests_seconds_bucket{address="localhost:8080",method="GET",route="/metrics",status="200",throwable="n/a",le="0.055924051",} 1.0
ktor_http_server_requests_seconds_bucket{address="localhost:8080",method="GET",route="/metrics",status="200",throwable="n/a",le="0.061516456",} 1.0
ktor_http_server_requests_seconds_bucket{address="localhost:8080",method="GET",route="/metrics",status="200",throwable="n/a",le="0.067108864",} 1.0
ktor_http_server_requests_seconds_bucket{address="localhost:8080",method="GET",route="/metrics",status="200",throwable="n/a",le="0.089478485",} 1.0
ktor_http_server_requests_seconds_bucket{address="localhost:8080",method="GET",route="/metrics",status="200",throwable="n/a",le="0.1",} 1.0
ktor_http_server_requests_seconds_bucket{address="localhost:8080",method="GET",route="/metrics",status="200",throwable="n/a",le="0.111848106",} 1.0
ktor_http_server_requests_seconds_bucket{address="localhost:8080",method="GET",route="/metrics",status="200",throwable="n/a",le="0.134217727",} 1.0
ktor_http_server_requests_seconds_bucket{address="localhost:8080",method="GET",route="/metrics",status="200",throwable="n/a",le="0.156587348",} 1.0
ktor_http_server_requests_seconds_bucket{address="localhost:8080",method="GET",route="/metrics",status="200",throwable="n/a",le="0.178956969",} 1.0
ktor_http_server_requests_seconds_bucket{address="localhost:8080",method="GET",route="/metrics",status="200",throwable="n/a",le="0.20132659",} 1.0
ktor_http_server_requests_seconds_bucket{address="localhost:8080",method="GET",route="/metrics",status="200",throwable="n/a",le="0.223696211",} 1.0
ktor_http_server_requests_seconds_bucket{address="localhost:8080",method="GET",route="/metrics",status="200",throwable="n/a",le="0.246065832",} 1.0
ktor_http_server_requests_seconds_bucket{address="localhost:8080",method="GET",route="/metrics",status="200",throwable="n/a",le="0.268435456",} 1.0
ktor_http_server_requests_seconds_bucket{address="localhost:8080",method="GET",route="/metrics",status="200",throwable="n/a",le="0.357913941",} 1.0
ktor_http_server_requests_seconds_bucket{address="localhost:8080",method="GET",route="/metrics",status="200",throwable="n/a",le="0.447392426",} 1.0
ktor_http_server_requests_seconds_bucket{address="localhost:8080",method="GET",route="/metrics",status="200",throwable="n/a",le="0.5",} 1.0
ktor_http_server_requests_seconds_bucket{address="localhost:8080",method="GET",route="/metrics",status="200",throwable="n/a",le="0.536870911",} 1.0
ktor_http_server_requests_seconds_bucket{address="localhost:8080",method="GET",route="/metrics",status="200",throwable="n/a",le="0.626349396",} 1.0
ktor_http_server_requests_seconds_bucket{address="localhost:8080",method="GET",route="/metrics",status="200",throwable="n/a",le="0.715827881",} 1.0
ktor_http_server_requests_seconds_bucket{address="localhost:8080",method="GET",route="/metrics",status="200",throwable="n/a",le="0.805306366",} 1.0
ktor_http_server_requests_seconds_bucket{address="localhost:8080",method="GET",route="/metrics",status="200",throwable="n/a",le="0.894784851",} 1.0
ktor_http_server_requests_seconds_bucket{address="localhost:8080",method="GET",route="/metrics",status="200",throwable="n/a",le="0.984263336",} 1.0
ktor_http_server_requests_seconds_bucket{address="localhost:8080",method="GET",route="/metrics",status="200",throwable="n/a",le="1.073741824",} 1.0
ktor_http_server_requests_seconds_bucket{address="localhost:8080",method="GET",route="/metrics",status="200",throwable="n/a",le="1.431655765",} 1.0
ktor_http_server_requests_seconds_bucket{address="localhost:8080",method="GET",route="/metrics",status="200",throwable="n/a",le="1.789569706",} 1.0
ktor_http_server_requests_seconds_bucket{address="localhost:8080",method="GET",route="/metrics",status="200",throwable="n/a",le="2.147483647",} 1.0
ktor_http_server_requests_seconds_bucket{address="localhost:8080",method="GET",route="/metrics",status="200",throwable="n/a",le="2.505397588",} 1.0
ktor_http_server_requests_seconds_bucket{address="localhost:8080",method="GET",route="/metrics",status="200",throwable="n/a",le="2.863311529",} 1.0
ktor_http_server_requests_seconds_bucket{address="localhost:8080",method="GET",route="/metrics",status="200",throwable="n/a",le="3.22122547",} 1.0
ktor_http_server_requests_seconds_bucket{address="localhost:8080",method="GET",route="/metrics",status="200",throwable="n/a",le="3.579139411",} 1.0
ktor_http_server_requests_seconds_bucket{address="localhost:8080",method="GET",route="/metrics",status="200",throwable="n/a",le="3.937053352",} 1.0
ktor_http_server_requests_seconds_bucket{address="localhost:8080",method="GET",route="/metrics",status="200",throwable="n/a",le="4.294967296",} 1.0
ktor_http_server_requests_seconds_bucket{address="localhost:8080",method="GET",route="/metrics",status="200",throwable="n/a",le="5.726623061",} 1.0
ktor_http_server_requests_seconds_bucket{address="localhost:8080",method="GET",route="/metrics",status="200",throwable="n/a",le="7.158278826",} 1.0
ktor_http_server_requests_seconds_bucket{address="localhost:8080",method="GET",route="/metrics",status="200",throwable="n/a",le="8.589934591",} 1.0
ktor_http_server_requests_seconds_bucket{address="localhost:8080",method="GET",route="/metrics",status="200",throwable="n/a",le="10.021590356",} 1.0
ktor_http_server_requests_seconds_bucket{address="localhost:8080",method="GET",route="/metrics",status="200",throwable="n/a",le="11.453246121",} 1.0
ktor_http_server_requests_seconds_bucket{address="localhost:8080",method="GET",route="/metrics",status="200",throwable="n/a",le="12.884901886",} 1.0
ktor_http_server_requests_seconds_bucket{address="localhost:8080",method="GET",route="/metrics",status="200",throwable="n/a",le="14.316557651",} 1.0
ktor_http_server_requests_seconds_bucket{address="localhost:8080",method="GET",route="/metrics",status="200",throwable="n/a",le="15.748213416",} 1.0
ktor_http_server_requests_seconds_bucket{address="localhost:8080",method="GET",route="/metrics",status="200",throwable="n/a",le="17.179869184",} 1.0
ktor_http_server_requests_seconds_bucket{address="localhost:8080",method="GET",route="/metrics",status="200",throwable="n/a",le="20.0",} 1.0
ktor_http_server_requests_seconds_bucket{address="localhost:8080",method="GET",route="/metrics",status="200",throwable="n/a",le="+Inf",} 1.0
ktor_http_server_requests_seconds_count{address="localhost:8080",method="GET",route="/metrics",status="200",throwable="n/a",} 1.0
ktor_http_server_requests_seconds_sum{address="localhost:8080",method="GET",route="/metrics",status="200",throwable="n/a",} 0.021426668
# HELP ktor_http_server_requests_active
# TYPE ktor_http_server_requests_active gauge
ktor_http_server_requests_active 1.0
# HELP jvm_buffer_count_buffers An estimate of the number of buffers in the pool
# TYPE jvm_buffer_count_buffers gauge
jvm_buffer_count_buffers{id="mapped",} 0.0
jvm_buffer_count_buffers{id="direct",} 6.0
# HELP jvm_memory_used_bytes The amount of used memory
# TYPE jvm_memory_used_bytes gauge
jvm_memory_used_bytes{area="nonheap",id="CodeHeap 'profiled nmethods'",} 2629376.0
jvm_memory_used_bytes{area="heap",id="G1 Survivor Space",} 6291456.0
jvm_memory_used_bytes{area="heap",id="G1 Old Gen",} 0.0
jvm_memory_used_bytes{area="nonheap",id="Metaspace",} 2.4776112E7
jvm_memory_used_bytes{area="nonheap",id="CodeHeap 'non-nmethods'",} 1170432.0
jvm_memory_used_bytes{area="heap",id="G1 Eden Space",} 1.2582912E7
jvm_memory_used_bytes{area="nonheap",id="Compressed Class Space",} 2673248.0
jvm_memory_used_bytes{area="nonheap",id="CodeHeap 'non-profiled nmethods'",} 507008.0
# HELP jvm_gc_live_data_size_bytes Size of long-lived heap memory pool after reclamation
# TYPE jvm_gc_live_data_size_bytes gauge
jvm_gc_live_data_size_bytes 0.0
# HELP process_cpu_usage The "recent cpu usage" for the Java Virtual Machine process
# TYPE process_cpu_usage gauge
process_cpu_usage 9.6815834767642E-4
# HELP jvm_gc_memory_allocated_bytes_total Incremented for an increase in the size of the (young) heap memory pool after one GC to before the next
# TYPE jvm_gc_memory_allocated_bytes_total counter
jvm_gc_memory_allocated_bytes_total 2.3068672E7
# HELP jvm_gc_memory_promoted_bytes_total Count of positive increases in the size of the old generation memory pool before GC to after GC
# TYPE jvm_gc_memory_promoted_bytes_total counter
jvm_gc_memory_promoted_bytes_total 0.0
Promehteusから収集する
最後に公開されているメトリクスをPrometheus側から取得したいと思います。
まずは
global:
  scrape_interval:     15s
  evaluation_interval: 15s

rule_files:

scrape_configs:
  - job_name: prometheus
    static_configs:
      - targets: ['host.docker.internal:8080/metric']
余談ですがDocker 20.10系からLinuxで--add-host=host.docker.internal:host-gatewayみたいな感じで起動時にオプションを渡してやるとhost.docker.internalでホストマシンにアクセスできるようになったみたいですね。
PrometheusをDockerで起動します。この際に上記の設定ファイルをマウントするようにします。
docker run \
    --add-host=host.docker.internal:host-gateway \
    -p 9090:9090 \
    -v /path/to/four/config/prometheus.yml:/etc/prometheus/prometheus.yml \
    prom/prometheus
これでPrometheusが起動し、localhost:9090でUIに接続できます。
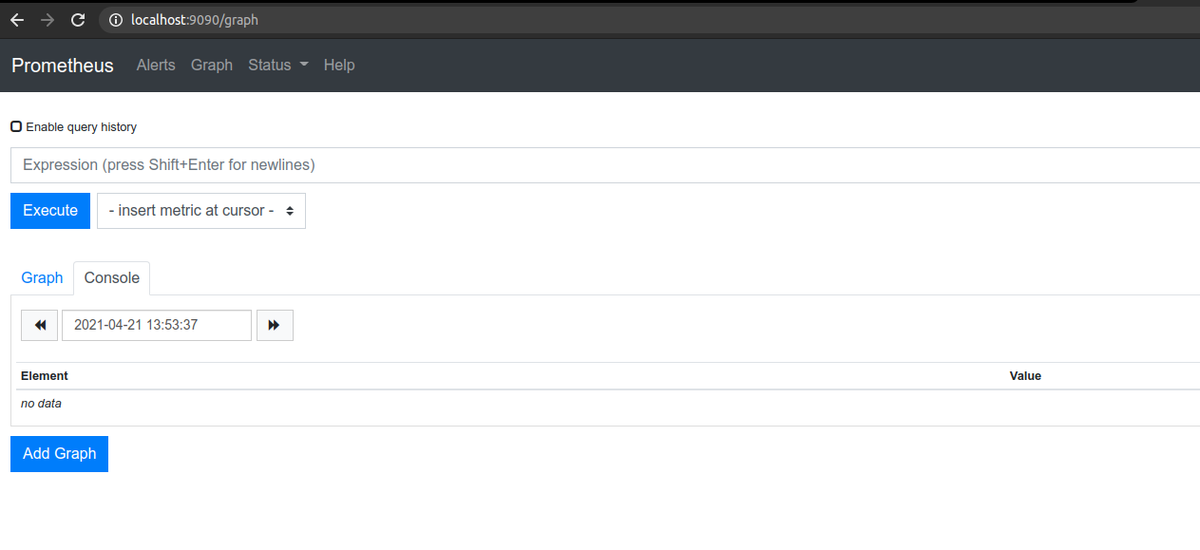
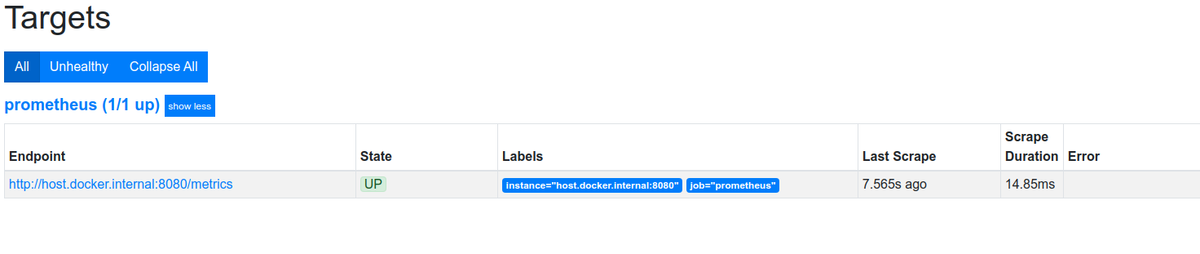
ターゲットの一覧を確認するときちんとアプリが認識されているのがわかります。
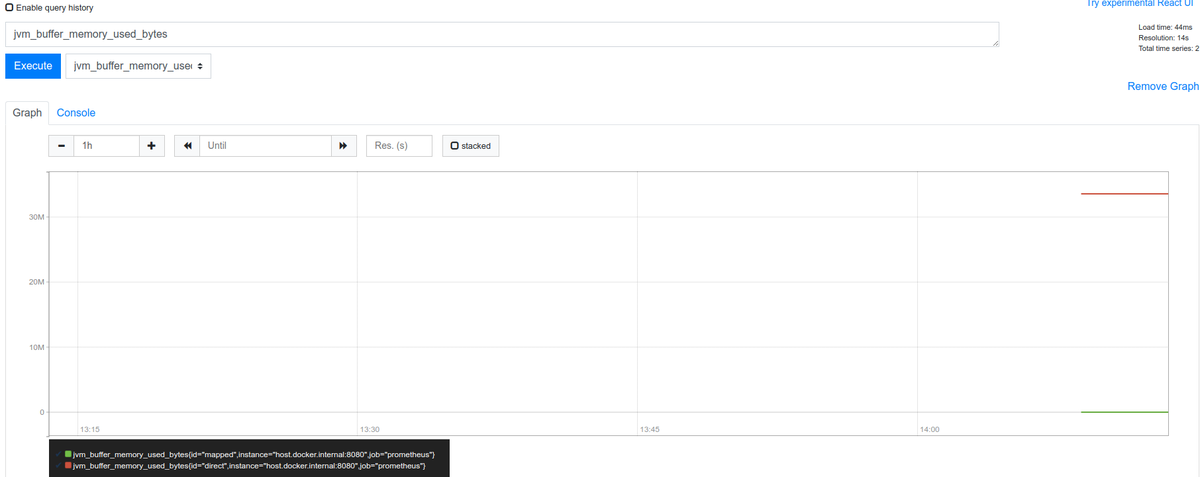
以下のようにjvm_buffer_count_buffersも可視化できました。
Docker 20.10.0についてまとめる
はじめに
だいぶ前ですがDokcer 20.10.0がリリースされています。かねてからやろうと思ってやってなかったのですが、リリースノートを眺めて、気になったところをかいつまんでまとめてみようと思います。
ものによっては動かしてみようかと。
やっていく
環境
$ uname -srvmpio
Linux 5.4.0-70-generic #78-Ubuntu SMP Fri Mar 19 13:29:52 UTC 2021 x86_64 x86_64 x86_64 GNU/Linux

$ lsb_release -a
LSB Version:    core-11.1.0ubuntu2-noarch:security-11.1.0ubuntu2-noarch
Distributor ID: Ubuntu
Description:    Ubuntu 20.04.2 LTS
Release:    20.04
Codename:   focal


$ docker version
Client: Docker Engine - Community
 Version:           20.10.5
 API version:       1.41
 Go version:        go1.13.15
 Git commit:        55c4c88
 Built:             Tue Mar  2 20:18:20 2021
 OS/Arch:           linux/amd64
 Context:           default
 Experimental:      true

Server: Docker Engine - Community
 Engine:
  Version:          20.10.5
  API version:      1.41 (minimum version 1.12)
  Go version:       go1.13.15
  Git commit:       363e9a8
  Built:            Tue Mar  2 20:16:15 2021
  OS/Arch:          linux/amd64
  Experimental:     true
 containerd:
  Version:          1.4.4
  GitCommit:        05f951a3781f4f2c1911b05e61c160e9c30eaa8e
 runc:
  Version:          1.0.0-rc93
  GitCommit:        12644e614e25b05da6fd08a38ffa0cfe1903fdec
 docker-init:
  Version:          0.19.0
  GitCommit:        de40ad0
今回、使用するDockerは20.10.5ですが、20.10.0の変更点のみをまとめていこうと思います。
API
GET /eventsでpruneのイベントを取得できる
例えば、以下のようにcurl --unix-socket /var/run/docker.sock http:/v1.41/eventsにアクセスした状態で、docker system pruneコマンドを実行すると、以下のようにイベントを取得することができます。
$ curl --unix-socket /var/run/docker.sock http:/v1.41/events
{"status":"prune","Type":"container","Action":"prune","Actor":{"ID":"","Attributes":{"reclaimed":"0"}},"scope":"local","time":1618107008,"timeNano":1618107008756813704}
{"Type":"network","Action":"prune","Actor":{"ID":"","Attributes":{"reclaimed":"0"}},"scope":"local","time":1618107008,"timeNano":1618107008758330171}
{"status":"prune","Type":"image","Action":"prune","Actor":{"ID":"","Attributes":{"reclaimed":"0"}},"scope":"local","time":1618107008,"timeNano":1618107008798691967}
{"Type":"builder","Action":"prune","Actor":{"ID":"","Attributes":{"reclaimed":"0"}},"scope":"local","time":1618107008,"timeNano":1618107008866211129}
このエンドポイントはcontainer、network、 volume、 imageそれぞれに対してreclaimed(回収したバイト数)を取得することができます。
GET /infoに対する変更点
以下のような変更点があります。
- OSのVersionを取得できるようになった
- DefaultAddressPoolsを取得できるようになった
Builder
#syntaxなしで、RUN --mountオプションを利用できるようになった
もともとBuildKitのRUN --mount拡張機能を利用したい場合は``のようなコメント行をDockerfileの先頭に追加する必要がありましたが不要になりました。
ARGがENVのように複数の値を受け付けるように変更
ARGコマンドは変数を定義してビルド時に--build-arg <varname>=<value>のフラグを利用することによって引数を渡すことができます。このARGコマンドが今回の変更でENVと同じように複数定義を一行でできるように修正さています。
ADDコマンドに--chownパラメーター拡張を渡せるようになった
もともとADD/COPYコマンドでは--chownフラグを指定できファイルオーナーを設定できますしかし、ADDコマンドではARGやENVで定義された変数からの指定ができないようになってました。しかし今回の修正でそれが行えるようになったようです。
Clientクライアントでは以下のような修正が行われています
- -a/--all-tagsフラグですべてのタグをpushできるようになった
- Kubernetesの
username/password認証をサポート runコマンドとcreateコマンドに--pull=missing|always|neverフラグを追加docker execに--env-fileフラグがついかされ環境変数を渡せるようになったlog-driverが追加されPrettyオプションが利用可能になった--cgroupnsフラグでネームスペースを指定できようになったdocker manifest rmローカルストレージのマニフェストリストドラフト(設定やレイヤーの情報を保持)を削除docker infoとdocker versionにコンテキストの情報を出力するように変更
Runtime
ランタイムでは以下のような修正が行われています。
- cgroup2のサポート
- cgroup2がデフォルトで
systemdのcgroupを利用するようになった - 新しいストレージドライバ
fuse-overlayfs - containerdのバイナリを1.4.3にアップデート
docker pushのデフォルトがすべてのタグのPushからlatestに変更- イメージをPullする際のコネクションロスでリコネクトする回数を指定できるように変更
- コンテナスタートアップのために、最低のメモリリミットを6Mへ変更。
Networking
host.docker.internalのLinuxでのサポート
最後の方力尽きましたが、すべての変更に関してはこちらをご確認ください
QuarkusのDevServicesを試す
はじめに
先日、Quarkusの1.13がリリースされので、リリースブログを眺めていたのですがDevServicesという便利そうな機能が追加されていたので試してみようかと思います。
DevServicesとは
DevモードでQuarkusを起動した場合、追加の設定無しでDBを起動してくれてDevモードのコンフィグとバインドしてくれるようです。
例えば、PostgresSQL JDBCの拡張がPomの依存に追加されている場合Testcontainersを使って(もしくはJavaのプロセス内で)自動的にDBを立ち上げてくれます。(今回は試しませんがReactiveクライアントにも対応しているようです)
現在DevSercicesは以下のDBに対応しているようです。
- Postgresql (コンテナ)
- MySQL (コンテナ)
- MariaDB (コンテナ)
- H2 (プロセス内)
- Apache Derby (プロセス内)
- DB2 (コンテナ)
- MSSQL (コンテナ)
また、DB2とMSSQLに関してはライセンスへの同意が必要です。src/main/resources/container-license-acceptance.txtを作成して以下のようなテキストを記述する必要があります。
ibmcom/db2:11.5.0.0a
mcr.microsoft.com/mssql/server:2017-CU12
使ってみる
環境
今回は以下の環境でアプリを動かします。
$ java --version
openjdk 16 2021-03-16
OpenJDK Runtime Environment (build 16+36-2231)
OpenJDK 64-Bit Server VM (build 16+36-2231, mixed mode, sharing)

$ mvn --version
Apache Maven 3.6.3
Maven home: /usr/share/maven
Java version: 16, vendor: Oracle Corporation, runtime: /home/username/.sdkman/candidates/java/16-open
Default locale: ja_JP, platform encoding: UTF-8
OS name: "linux", version: "5.4.0-70-generic", arch: "amd64", family: "unix"

$ docker version
Client: Docker Engine - Community
 Version:           20.10.5
 API version:       1.41
 Go version:        go1.13.15
 Git commit:        55c4c88
 Built:             Tue Mar  2 20:18:20 2021
 OS/Arch:           linux/amd64
 Context:           default
 Experimental:      true

Server: Docker Engine - Community
 Engine:
  Version:          20.10.5
  API version:      1.41 (minimum version 1.12)
  Go version:       go1.13.15
  Git commit:       363e9a8
  Built:            Tue Mar  2 20:16:15 2021
  OS/Arch:          linux/amd64
  Experimental:     true
 containerd:
  Version:          1.4.4
  GitCommit:        05f951a3781f4f2c1911b05e61c160e9c30eaa8e
 runc:
  Version:          1.0.0-rc93
  GitCommit:        12644e614e25b05da6fd08a38ffa0cfe1903fdec
 docker-init:
  Version:          0.19.0
  GitCommit:        de40ad0
プロジェクトを作成する
今回はPosgresSQLを利用して、DBに保存されたデータを返す簡単なAPIを記述しようと思います。
以下の構成でプロジェクトを作成します。

Devモードでアプリケーションを起動する
DevServcesはデフォルトでオンになっており、DB URLやパスワード、ユーザ名が設定されていなければTestcontainersを使ってDBを立ち上げてくれます。
先程、作成したプロジェクトをunzipしてなにも変更せずにDevモードで起動すると以下のようなログを出力してDBも立ち上げてくれます。
$ ./mvnw compile quarkus:dev
[INFO] Scanning for projects...
[INFO]
[INFO] ----------------------< dev.hirooka:devservices >-----------------------
[INFO] Building devservices 1.0.0-SNAPSHOT
[INFO] --------------------------------[ jar ]---------------------------------
[INFO]
[INFO] --- quarkus-maven-plugin:1.13.0.Final:generate-code (default) @ devservices ---
[INFO]
[INFO] --- maven-resources-plugin:2.6:resources (default-resources) @ devservices ---
[INFO] Using 'UTF-8' encoding to copy filtered resources.
[INFO] Copying 2 resources
[INFO]
[INFO] --- maven-compiler-plugin:3.8.1:compile (default-compile) @ devservices ---
[INFO] Nothing to compile - all classes are up to date
[INFO]
[INFO] --- quarkus-maven-plugin:1.13.0.Final:dev (default-cli) @ devservices ---
Listening for transport dt_socket at address: 5005
2021-04-05 12:13:24,948 INFO  [org.tes.doc.DockerClientProviderStrategy] (build-28) Loaded org.testcontainers.dockerclient.EnvironmentAndSystemPropertyClientProviderStrategy from ~/.testcontainers.properties, will try it first
2021-04-05 12:13:25,299 INFO  [org.tes.doc.DockerClientProviderStrategy] (build-28) Found Docker environment with Environment variables, system properties and defaults. Resolved dockerHost=unix:///var/run/docker.sock
2021-04-05 12:13:25,300 INFO  [org.tes.DockerClientFactory] (build-28) Docker host IP address is localhost
2021-04-05 12:13:25,324 INFO  [org.tes.DockerClientFactory] (build-28) Connected to docker:
  Server Version: 20.10.5
  API Version: 1.41
  Operating System: Ubuntu 20.04.2 LTS
  Total Memory: 31741 MB
2021-04-05 12:13:25,326 INFO  [org.tes.uti.ImageNameSubstitutor] (build-28) Image name substitution will be performed by: DefaultImageNameSubstitutor (composite of 'ConfigurationFileImageNameSubstitutor' and 'PrefixingImageNameSubstitutor')
2021-04-05 12:13:25,352 INFO  [org.tes.uti.RegistryAuthLocator] (build-28) Failure when attempting to lookup auth config. Please ignore if you don't have images in an authenticated registry. Details: (dockerImageName: testcontainers/ryuk:0.3.1, configFile: /home/yuya-hirooka/.docker/config.json. Falling back to docker-java default behaviour. Exception message: /home/yuya-hirooka/.docker/config.json (そのようなファイルやディレクトリはありません)
2021-04-05 12:13:26,102 INFO  [org.tes.DockerClientFactory] (build-28) Ryuk started - will monitor and terminate Testcontainers containers on JVM exit
2021-04-05 12:13:26,103 INFO  [org.tes.DockerClientFactory] (build-28) Checking the system...
2021-04-05 12:13:26,103 INFO  [org.tes.DockerClientFactory] (build-28) ✔︎ Docker server version should be at least 1.6.0
2021-04-05 12:13:26,185 INFO  [org.tes.DockerClientFactory] (build-28) ✔︎ Docker environment should have more than 2GB free disk space
2021-04-05 12:13:26,295 INFO  [🐳 .6.12]] (build-28) Creating container for image: postgres:9.6.12
2021-04-05 12:13:26,337 INFO  [🐳 .6.12]] (build-28) Starting container with ID: 33b42f67a20ed4d4ff1b2f0135ec06b13c3444e5782567e4d30395e0c5741fd3
2021-04-05 12:13:26,710 INFO  [🐳 .6.12]] (build-28) Container postgres:9.6.12 is starting: 33b42f67a20ed4d4ff1b2f0135ec06b13c3444e5782567e4d30395e0c5741fd3
2021-04-05 12:13:30,167 INFO  [🐳 .6.12]] (build-28) Container postgres:9.6.12 started in PT3.98152593S
__  ____  __  _____   ___  __ ____  ______
 --/ __ \/ / / / _ | / _ \/ //_/ / / / __/
 -/ /_/ / /_/ / __ |/ , _/ ,< / /_/ /\ \
--\___\_\____/_/ |_/_/|_/_/|_|\____/___/
2021-04-05 12:13:30,588 INFO  [io.quarkus] (Quarkus Main Thread) devservices 1.0.0-SNAPSHOT on JVM (powered by Quarkus 1.13.0.Final) started in 6.064s. Listening on: http://localhost:8080
2021-04-05 12:13:30,589 INFO  [io.quarkus] (Quarkus Main Thread) Profile dev activated. Live Coding activated.
2021-04-05 12:13:30,589 INFO  [io.quarkus] (Quarkus Main Thread) Installed features: [agroal, cdi, hibernate-orm, jdbc-postgresql, mutiny, narayana-jta, resteasy, smallrye-context-propagation]
docker psコマンドで確認してみるとPostgresとTestcontainersのコンテナがきどうしているのが確認できます。
$ docker ps
CONTAINER ID   IMAGE                       COMMAND                  CREATED         STATUS         PORTS                     NAMES
74541a57e8cd   postgres:9.6.12             "docker-entrypoint.s…"   3 minutes ago   Up 3 minutes   0.0.0.0:49164->5432/tcp   great_blackburn
72f55524eecf   testcontainers/ryuk:0.3.1   "/app"                   3 minutes ago   Up 3 minutes   0.0.0.0:49163->8080/tcp   testcontainers-ryuk-42c2bcf5-1ddc-415d-b694-3f7f311d885e
データを取得してみる
それでは、実際にこの起動したDB利用してみようと思います。
まずは初期データを投入します。
まずはapplication.propertiesを以下のように修正します。
%dev.quarkus.hibernate-orm.log.sql=true
%dev.quarkus.hibernate-orm.database.generation=drop-and-create
quarkus.hibernate-orm.database.generation=drop-and-createを指定することで、Quarkusのアプリは起動時にsqlファイルを読み取ってテーブルを作成してくれるようになります。
また、デフォルトではresourcesのimport.sqlという名前のファイルを読み取るようになっているのでそちらも用意しておきます。
drop table if exists message;

create table message(
    id      int,
    content varchar(100)
);

insert into message
values (1, 'hello, dev service1'),
       (2, 'hello, dev service2'),
       (3, 'hello, dev service3');
quarkus.hibernate-orm.log.sqlはSQLの実行がわかりやすいように設定しています。また%devはDevモードで起動時に有効になる設定を示します。
この状態でアプリケーションを再起動します。
すると、ここには記述しませんが実行されたSQLのログが出力されるはずです。
ここまでで、起動したDBを利用できていることががある程度確認できたかもしれませんが。
EntityとControllerを作成してmessageを取得してみようと思います。
MessageEntity.java
@Entity
public class MessageEntity {

    @Id
    private int id;

    private String content;

    public int getId() {
        return id;
    }

    public void setId(int id) {
        this.id = id;
    }

    public String getContent() {
        return content;
    }

    public void setContent(String content) {
        this.content = content;
    }
}
GreetingResource .java
@Path("/messages")
public class GreetingResource {
    private EntityManager em;

    public GreetingResource(EntityManager em) {
        this.em = em;
    }


    @GET
    @Produces(MediaType.APPLICATION_JSON)
    public List<MessageEntity> hello() {
        return em.createNativeQuery("select id, content from message", MessageEntity.class).getResultList();
    }
}
コントローラーはデフォルトで作成されたGreetingResource.javaを少し改造して作っています。また、少し筋は悪いかもしれませんがEntityをそのままレスポンスとして返すようにしています。
アプリケーションがリロードされたらcURLを叩いてみます。
$ curl localhost:8080/messages
[{"id":1,"content":"hello, dev service1"},{"id":2,"content":"hello, dev service2"},{"id":3,"content":"hello, dev service3"}]
import.sqlでセットしていた値が帰ってきていることが確認できました。
本番用の設定を記述する
前述したとおりDevServicesはDB URLなどがセットされている場合においてDBを起動しないようになっています。
例えば、以下のように設定を記述してアプリケーションを起動すると、DBが起動されません。
quarkus.datasource.db-kind=postgresql
quarkus.datasource.jdbc.url=jdbc:postgresql://localhost:5432/hibernate_orm_test
quarkus.datasource.username=username
quarkus.datasource.password=password
起動すると、import.sqlの実行に失敗したエラーログが出力されたと思います。
application.properitesに本番用の設定値を書きたいが、ローカルでの開発ではDevServicesを利用したい場合は設定のプリフィクスとして%prodを以下のように付与します。
%prod.quarkus.datasource.db-kind=postgresql
%prod.quarkus.datasource.jdbc.url=jdbc:postgresql://localhost:5432/hibernate_orm_test
%prod.quarkus.datasource.username=username
%prod.quarkus.datasource.password=password
これで上記の設定はDevモードでは用いられることはなくDevServicesはDBを立ち上げてくれます。
その他の設定値
最後にDevServicesの設定をいくつかまとめておこうと思います。完全なリストはこちら をご覧ください。
| 設定値 | 説明 | デフォルト値(型) |
|---|---|---|
| quarkus.datasource.devservices | DevServicesを明示的に有効化するかのフラグ | true(boolean) |
| quarkus.datasource.devservices.image-name | 利用するコンテナイメージ名を指定する。もしH2などコンテナを起動しないサービスの場合は影響を及ぼさない | (string) |
また、ここにはまとめてませんが、名前付きデータソースごとにそれぞれの設定を行なうことも可能なようです。
k8s上のSpring Bootアプリからメトリクスを取得する(Actuator + Prometheus Operator)
はじめに
Kubernetes上でのSpring Bootのアプリのデバックを行なう際にPodのコンテナ内に応じて必要なコマンドとってきて、スレッドダンプやヒープダンプを取得してホストにコピーみたいなことをやっていたのですが、流石に面倒に感じはじめました。
そこでふとActuator入れりゃええやんと思いたち、どうせだったら、Prometeheusでメトリクスの収集までできればいろいろええんじゃないかと思いいろいろ動かしてみようと思います。
Spring Boot Actuatorとは
(まず、前提としてこのブログはBoot 2.4系のドキュメントを確認してます。貼られているリンクもそうなってると思います。)
Spring Boot Actuatorはアプリケーションをモニター、マネージするための追加機能を提供してくれています。HTTPやJMXのエンドポイントを通して操作を選択することができます(JMXを利用する場合はspring.jmx.enabledをtrueで設定する必要があります)。HTTPを利用する場合はデフォルトでは/actuator/{id}の形式で情報を取得することが可能で、たとえばhealthの情報を取得したい場合は/actuator/healthのエンドポイントで利用できます。カスタムエンドポイントを公開することもできますが、基本としては以下のようなエンドポイントが用意されています。
| ID | 説明 |
|---|---|
| health | アプリケーションの正常性情報を取得でる。このエンドポイントを通して、実行中のアプリケーション(本体と関連するアプリケーション)ステータスを確認することができる。関連するアプリケーションに関してはHealthContributorRegistryに定義されているすべてのHealthContributorから収集される。(詳細はこちら) |
| httptrace | HTTPのトレース情報(リクエスト/レスポンス)を取得できる。デフォルトで最新100個をインメモリに保存。HTTP トレースを有効にするには、アプリケーションの構成で HttpTraceRepository型をBeanとして提供する必要がある |
| beans | アプリケーション内のSpring Beanのリストを取得できる |
| mappings | @RequestMappingのパスのリストを表示します |
| shutdown | アップリケーションをシャットダウンする |
| threaddump | スレッドダンプを取得できる |
| heapdump | hprofヒープダンプを取得できる。アプリケーションがSpring MVCやWebFluxである場合に有効 |
| logfile | ログの内容を返す。logging.file.nameかlogging.file.pathプロパティが設定されている必要がある。アプリケーションがアプリケーションがSpring MVCやWebFluxである場合に有効 |
詳細なリストに関してはこちらをご覧ください。
また、Prometheusフォーマットで出力してくれるエンドポイントも提供されており今回はこちらを利用して、メトリクスを収集しようと思います。
エンドポイントの公開に関するセキュリティ的な考慮点に付いて
Actuatorでアプリケーションのインフラレイヤーやアプリケーションレイヤーで保護しておく必要があります。アプリケーションレイヤーでは「必要なエンドポイントのみ公開する」のが基本的な戦略となると思います。ActuatorではデフォルトでHTTPのエンドポイントはhealthとinfo以外は非公開になっているようです。
これらのエンドポイントを公開非公開を制御する場合は以下のようなincludeもしくはexcluedeプロパティを使用します。例えば、info, health, threaddumpのエンドポイントを公開したい場合は、アプリケーションプロパティで以下のように設定します。
management.endpoints.web.exposure.include=info, health, threaddump
その他のプロパティに関してはこちらをご覧ください。
単純な公開非公開とは別に、Spring Securityを利用している場合、そのコンテンツネゴシエーションの仕組みを利用してエンドポイントを保護することができます。例えば、特定のロールを持つユーザのみアクセス可能と言ったような制御を行なうことができます。
やっていく
環境
今回KubernetesのクラスタはMinikubeを用いてローカルに構成します。そのVMはデフォルトのDockerを利用します。
各ミドルウェア、OSのバージョンは以下のとおりです。
$ uname -srvmpio
Linux 5.4.0-70-generic #78-Ubuntu SMP Fri Mar 19 13:29:52 UTC 2021 x86_64 x86_64 x86_64 GNU/Linux

$ lsb_release -a
LSB Version:    core-11.1.0ubuntu2-noarch:security-11.1.0ubuntu2-noarch
Distributor ID: Ubuntu
Description:    Ubuntu 20.04.2 LTS
Release:    20.04
Codename:   focal


(Minikubeが動いているDocker)
$ docker version

(クライアントは省略)

Server: Docker Engine - Community
 Engine:
  Version:          20.10.5
  API version:      1.41 (minimum version 1.12)
  Go version:       go1.13.15
  Git commit:       363e9a8
  Built:            Tue Mar  2 20:16:15 2021
  OS/Arch:          linux/amd64
  Experimental:     true
 containerd:
  Version:          1.4.4
  GitCommit:        05f951a3781f4f2c1911b05e61c160e9c30eaa8e
 runc:
  Version:          1.0.0-rc93
  GitCommit:        12644e614e25b05da6fd08a38ffa0cfe1903fdec
 docker-init:
  Version:          0.19.0
  GitCommit:        de40ad0


$ minikube version
minikube version: v1.16.0
commit: 9f1e482427589ff8451c4723b6ba53bb9742fbb1

$ kubectl version -o yaml
clientVersion:
  buildDate: "2021-03-18T01:10:43Z"
  compiler: gc
  gitCommit: 6b1d87acf3c8253c123756b9e61dac642678305f
  gitTreeState: clean
  gitVersion: v1.20.5
  goVersion: go1.15.8
  major: "1"
  minor: "20"
  platform: linux/amd64
serverVersion:
  buildDate: "2020-12-08T17:51:19Z"
  compiler: gc
  gitCommit: af46c47ce925f4c4ad5cc8d1fca46c7b77d13b38
  gitTreeState: clean
  gitVersion: v1.20.0
  goVersion: go1.15.5
  major: "1"
  minor: "20"
  platform: linux/amd64
環境構築
プロジェクトの作成 & Ptometeusのメトリクスを取得できるように設定
まずは、プロジェクトを作成します。
プロジェクトはSpring Initializrを利用して以下のような構成で作成します。
Webの他にActuatorとPrometheusの選択肢を選択肢てます。
出来上がったプロジェクトのPomの依存を確認すると以下の2つが存在することが確認できます。
<dependency>
    <groupId>org.springframework.boot</groupId>
    <artifactId>spring-boot-starter-actuator</artifactId>
</dependency>

<dependency>
    <groupId>io.micrometer</groupId>
    <artifactId>micrometer-registry-prometheus</artifactId>
    <scope>runtime</scope>
</dependency>
Actuatorの出力をPrometheusの形式で出力する場合micrometer-registry-prometheusの依存を追加する必要があります。今回は初期Initializrで追加しましたが、既存のBootプロジェクトにActuatorとPromtheusを使ってメトリクスの収集をする場合は上記の2つの依存を追加してやれば大丈夫だと思います。
コントローラーを作っておく
GETでリクエストを受けると文字列を返すコントローラーを作っておきます。
コンポーネントスキャン対象のパッケージ配下にいかのようなGreetingControllerを作成します。
@RestController
public class GreetingController {
    @GetMapping("/hello")
    public String hello(){
        return "hello, hello";
    }
}
起動してcURLで作ったコントローラーとActuatorのエンドポイントにアクセスしてみます。
$ curl localhost:8080/hello
hello, hello

$ curl localhost:8080/actuator/health
{"status":"UP"}
Prometheusのエンドポイントの公開設定を行なう
前述の通りActuatorのエンドポイントはhealthとinfo以外は非公開になっています。/actuatorにアクセスすると、公開されているエンドポイントの情報を取得することができます。
$ curl localhost:8080/actuator/ | jq
{
  "_links": {
    "self": {
      "href": "http://localhost:8080/actuator",
      "templated": false
    },
    "health": {
      "href": "http://localhost:8080/actuator/health",
      "templated": false
    },
    "health-path": {
      "href": "http://localhost:8080/actuator/health/{*path}",
      "templated": true
    },
    "info": {
      "href": "http://localhost:8080/actuator/info",
      "templated": false
    }
  }
Prometheus用のエンドポイントを公開するには、設定を追加する必要があります。
また、もともとの困りごとだったダンプの取得を行なうエンドポイントも公開しておきます。
アプリケーションプロパティに以下のように設定を行います。
# ついでにPort番号も変えておきます。
server.port=8888

management.endpoints.web.exposure.include=info, health, threaddump, prometheus, heapdump
再度/actuatorにアクセスしてみます。
$ curl localhost:8888/actuator | jq
{
  "_links": {
    "self": {
      "href": "http://localhost:8888/actuator",
      "templated": false
    },
    "health": {
      "href": "http://localhost:8888/actuator/health",
      "templated": false
    },
    "health-path": {
      "href": "http://localhost:8888/actuator/health/{*path}",
      "templated": true
    },
    "info": {
      "href": "http://localhost:8888/actuator/info",
      "templated": false
    },
    "heapdump": {
      "href": "http://localhost:8888/actuator/heapdump",
      "templated": false
    },
    "threaddump": {
      "href": "http://localhost:8888/actuator/threaddump",
      "templated": false
    },
    "prometheus": {
      "href": "http://localhost:8888/actuator/prometheus",
      "templated": false
    }
  }
}
yuya-hirooka@yuya-hirooka:~/source/java/actu
先程と比べて、設定したしたエンドポイントの情報が出力されているのがわかります。
Prometheus形式のメトリクスの取得をしてみます。
$ curl 'http://localhost:8888/actuator/prometheus'
# HELP jvm_memory_committed_bytes The amount of memory in bytes that is committed for the Java virtual machine to use
# TYPE jvm_memory_committed_bytes gauge
jvm_memory_committed_bytes{area="heap",id="G1 Survivor Space",} 0.0
jvm_memory_committed_bytes{area="heap",id="G1 Old Gen",} 5.4525952E7
jvm_memory_committed_bytes{area="nonheap",id="Metaspace",} 3.0539776E7
jvm_memory_committed_bytes{area="nonheap",id="CodeHeap 'non-nmethods'",} 2555904.0
jvm_memory_committed_bytes{area="heap",id="G1 Eden Space",} 4.6137344E7
jvm_memory_committed_bytes{area="nonheap",id="Compressed Class Space",} 4325376.0
jvm_memory_committed_bytes{area="nonheap",id="CodeHeap 'non-profiled nmethods'",} 6815744.0
# HELP tomcat_sessions_alive_max_seconds
# TYPE tomcat_sessions_alive_max_seconds gauge
tomcat_sessions_alive_max_seconds 0.0
# HELP jvm_threads_states_threads The current number of threads having NEW state
# TYPE jvm_threads_states_threads gauge
jvm_threads_states_threads{state="runnable",} 11.0
jvm_threads_states_threads{state="blocked",} 0.0
jvm_threads_states_threads{state="waiting",} 11.0
jvm_threads_states_threads{state="timed-waiting",} 4.0
jvm_threads_states_threads{state="new",} 0.0
jvm_threads_states_threads{state="terminated",} 0.0
# HELP system_cpu_usage The "recent cpu usage" for the whole system
# TYPE system_cpu_usage gauge
system_cpu_usage 1.0
# HELP jvm_gc_memory_promoted_bytes_total Count of positive increases in the size of the old generation memory pool before GC to after GC
# TYPE jvm_gc_memory_promoted_bytes_total counter
jvm_gc_memory_promoted_bytes_total 9284952.0
# HELP jvm_threads_peak_threads The peak live thread count since the Java virtual machine started or peak was reset
# TYPE jvm_threads_peak_threads gauge
jvm_threads_peak_threads 30.0
# HELP jvm_threads_daemon_threads The current number of live daemon threads
# TYPE jvm_threads_daemon_threads gauge
jvm_threads_daemon_threads 22.0
# HELP tomcat_sessions_active_current_sessions
# TYPE tomcat_sessions_active_current_sessions gauge
tomcat_sessions_active_current_sessions 0.0
# HELP jvm_buffer_total_capacity_bytes An estimate of the total capacity of the buffers in this pool
# TYPE jvm_buffer_total_capacity_bytes gauge
jvm_buffer_total_capacity_bytes{id="mapped - 'non-volatile memory'",} 0.0
jvm_buffer_total_capacity_bytes{id="mapped",} 0.0
jvm_buffer_total_capacity_bytes{id="direct",} 49152.0
# HELP system_load_average_1m The sum of the number of runnable entities queued to available processors and the number of runnable entities running on the available processors averaged over a period of time
# TYPE system_load_average_1m gauge
system_load_average_1m 2.04
# HELP jvm_memory_used_bytes The amount of used memory
# TYPE jvm_memory_used_bytes gauge
jvm_memory_used_bytes{area="heap",id="G1 Survivor Space",} 0.0
jvm_memory_used_bytes{area="heap",id="G1 Old Gen",} 1.8475864E7
jvm_memory_used_bytes{area="nonheap",id="Metaspace",} 3.016488E7
jvm_memory_used_bytes{area="nonheap",id="CodeHeap 'non-nmethods'",} 1257088.0
jvm_memory_used_bytes{area="heap",id="G1 Eden Space",} 0.0
jvm_memory_used_bytes{area="nonheap",id="Compressed Class Space",} 4117488.0
jvm_memory_used_bytes{area="nonheap",id="CodeHeap 'non-profiled nmethods'",} 6814208.0
# HELP system_cpu_count The number of processors available to the Java virtual machine
# TYPE system_cpu_count gauge
system_cpu_count 8.0
# HELP jvm_buffer_memory_used_bytes An estimate of the memory that the Java virtual machine is using for this buffer pool
# TYPE jvm_buffer_memory_used_bytes gauge
jvm_buffer_memory_used_bytes{id="mapped - 'non-volatile memory'",} 0.0
jvm_buffer_memory_used_bytes{id="mapped",} 0.0
jvm_buffer_memory_used_bytes{id="direct",} 49152.0
# HELP process_uptime_seconds The uptime of the Java virtual machine
# TYPE process_uptime_seconds gauge
process_uptime_seconds 231.285
# HELP tomcat_sessions_rejected_sessions_total
# TYPE tomcat_sessions_rejected_sessions_total counter
tomcat_sessions_rejected_sessions_total 0.0
# HELP tomcat_sessions_created_sessions_total
# TYPE tomcat_sessions_created_sessions_total counter
tomcat_sessions_created_sessions_total 0.0
# HELP logback_events_total Number of error level events that made it to the logs
# TYPE logback_events_total counter
logback_events_total{level="warn",} 0.0
logback_events_total{level="debug",} 0.0
logback_events_total{level="error",} 0.0
logback_events_total{level="trace",} 0.0
logback_events_total{level="info",} 7.0
# HELP jvm_classes_unloaded_classes_total The total number of classes unloaded since the Java virtual machine has started execution
# TYPE jvm_classes_unloaded_classes_total counter
jvm_classes_unloaded_classes_total 0.0
# HELP jvm_buffer_count_buffers An estimate of the number of buffers in the pool
# TYPE jvm_buffer_count_buffers gauge
jvm_buffer_count_buffers{id="mapped - 'non-volatile memory'",} 0.0
jvm_buffer_count_buffers{id="mapped",} 0.0
jvm_buffer_count_buffers{id="direct",} 6.0
# HELP process_cpu_usage The "recent cpu usage" for the Java Virtual Machine process
# TYPE process_cpu_usage gauge
process_cpu_usage 0.0
# HELP jvm_gc_live_data_size_bytes Size of long-lived heap memory pool after reclamation
# TYPE jvm_gc_live_data_size_bytes gauge
jvm_gc_live_data_size_bytes 1.8475864E7
# HELP jvm_gc_memory_allocated_bytes_total Incremented for an increase in the size of the (young) heap memory pool after one GC to before the next
# TYPE jvm_gc_memory_allocated_bytes_total counter
jvm_gc_memory_allocated_bytes_total 6.291456E7
# HELP tomcat_sessions_expired_sessions_total
# TYPE tomcat_sessions_expired_sessions_total counter
tomcat_sessions_expired_sessions_total 0.0
# HELP jvm_threads_live_threads The current number of live threads including both daemon and non-daemon threads
# TYPE jvm_threads_live_threads gauge
jvm_threads_live_threads 26.0
# HELP jvm_gc_pause_seconds Time spent in GC pause
# TYPE jvm_gc_pause_seconds summary
jvm_gc_pause_seconds_count{action="end of major GC",cause="Heap Dump Initiated GC",} 2.0
jvm_gc_pause_seconds_sum{action="end of major GC",cause="Heap Dump Initiated GC",} 0.077
jvm_gc_pause_seconds_count{action="end of minor GC",cause="G1 Evacuation Pause",} 1.0
jvm_gc_pause_seconds_sum{action="end of minor GC",cause="G1 Evacuation Pause",} 0.005
# HELP jvm_gc_pause_seconds_max Time spent in GC pause
# TYPE jvm_gc_pause_seconds_max gauge
jvm_gc_pause_seconds_max{action="end of major GC",cause="Heap Dump Initiated GC",} 0.0
jvm_gc_pause_seconds_max{action="end of minor GC",cause="G1 Evacuation Pause",} 0.0
# HELP http_server_requests_seconds
# TYPE http_server_requests_seconds summary
http_server_requests_seconds_count{exception="None",method="GET",outcome="SUCCESS",status="200",uri="/actuator/heapdump",} 2.0
http_server_requests_seconds_sum{exception="None",method="GET",outcome="SUCCESS",status="200",uri="/actuator/heapdump",} 0.425517121
http_server_requests_seconds_count{exception="None",method="GET",outcome="SUCCESS",status="200",uri="/actuator",} 1.0
http_server_requests_seconds_sum{exception="None",method="GET",outcome="SUCCESS",status="200",uri="/actuator",} 0.024393608
# HELP http_server_requests_seconds_max
# TYPE http_server_requests_seconds_max gauge
http_server_requests_seconds_max{exception="None",method="GET",outcome="SUCCESS",status="200",uri="/actuator/heapdump",} 0.0
http_server_requests_seconds_max{exception="None",method="GET",outcome="SUCCESS",status="200",uri="/actuator",} 0.0
# HELP process_start_time_seconds Start time of the process since unix epoch.
# TYPE process_start_time_seconds gauge
process_start_time_seconds 1.616906295082E9
# HELP tomcat_sessions_active_max_sessions
# TYPE tomcat_sessions_active_max_sessions gauge
tomcat_sessions_active_max_sessions 0.0
# HELP jvm_memory_max_bytes The maximum amount of memory in bytes that can be used for memory management
# TYPE jvm_memory_max_bytes gauge
jvm_memory_max_bytes{area="heap",id="G1 Survivor Space",} -1.0
jvm_memory_max_bytes{area="heap",id="G1 Old Gen",} 8.321499136E9
jvm_memory_max_bytes{area="nonheap",id="Metaspace",} -1.0
jvm_memory_max_bytes{area="nonheap",id="CodeHeap 'non-nmethods'",} 7553024.0
jvm_memory_max_bytes{area="heap",id="G1 Eden Space",} -1.0
jvm_memory_max_bytes{area="nonheap",id="Compressed Class Space",} 1.073741824E9
jvm_memory_max_bytes{area="nonheap",id="CodeHeap 'non-profiled nmethods'",} 2.44105216E8
# HELP jvm_classes_loaded_classes The number of classes that are currently loaded in the Java virtual machine
# TYPE jvm_classes_loaded_classes gauge
jvm_classes_loaded_classes 7304.0
# HELP process_files_open_files The open file descriptor count
# TYPE process_files_open_files gauge
process_files_open_files 60.0
# HELP jvm_gc_max_data_size_bytes Max size of long-lived heap memory pool
# TYPE jvm_gc_max_data_size_bytes gauge
jvm_gc_max_data_size_bytes 8.321499136E9
# HELP process_files_max_files The maximum file descriptor count
# TYPE process_files_max_files gauge
process_files_max_files 1048576.0
JVMの情報とか諸々が出力されてるが見て取れます。
threddump、heapdumpを取得するときは以下のようにします。
$ curl localhost:8888/actuator/threaddump -H 'Accept: text/plain' > threddump.txt
  % Total    % Received % Xferd  Average Speed   Time    Time     Time  Current
                                 Dload  Upload   Total   Spent    Left  Speed
100 30125  100 30125    0     0   668k      0 --:--:-- --:--:-- --:--:--  684k

$ curl 'http://localhost:8888/actuator/heapdump' -O
  % Total    % Received % Xferd  Average Speed   Time    Time     Time  Current
                                 Dload  Upload   Total   Spent    Left  Speed
100 27.6M  100 27.6M    0     0   124M      0 --:--:-- --:--:-- --:--:--  124M
Docker Imageの作成
アプリケーションの準備として最後に作成したアプリをDockerイメージ化しておきます。
ここで、今回はDockerのリポジトリを個別に用意したりDocker HubにイメージをPushのは面倒なので、Minikubeのコンテキストでイメージをビルドします。
具体的には次のコマンドを実行します。
$ eval $(minikube docker-env)
f

$ docker images
REPOSITORY                                TAG        IMAGE ID       CREATED         SIZE
kubernetesui/dashboard                    v2.1.0     9a07b5b4bfac   3 months ago    226MB
k8s.gcr.io/kube-proxy                     v1.20.0    10cc881966cf   3 months ago    118MB
k8s.gcr.io/kube-apiserver                 v1.20.0    ca9843d3b545   3 months ago    122MB
k8s.gcr.io/kube-scheduler                 v1.20.0    3138b6e3d471   3 months ago    46.4MB
k8s.gcr.io/kube-controller-manager        v1.20.0    b9fa1895dcaa   3 months ago    116MB
gcr.io/k8s-minikube/storage-provisioner   v4         85069258b98a   3 months ago    29.7MB
k8s.gcr.io/etcd                           3.4.13-0   0369cf4303ff   7 months ago    253MB
k8s.gcr.io/coredns                        1.7.0      bfe3a36ebd25   9 months ago    45.2MB
kubernetesui/metrics-scraper              v1.0.4     86262685d9ab   12 months ago   36.9MB
k8s.gcr.io/pause                          3.2        80d28bedfe5d   13 months ago   683kB
これで一時的にMinikubeのコンテキストでDocker ビルドできるようになりました。
minikube docker-envコマンドはMinikube組み込みのDockerデーモンをホストマシンから操作できるようにするためのコマンドです。
この状態でイメージをビルドします。
Spring Bootは2.3からBuildpackを利用したイメージのビルドをサポートしています。今回はその機能を利用してイメージを作成したいと思います。
具体的にはプロジェクトルートで以下のコマンドを実行します。
$ ./mvnw spring-boot:build-image -Dspring-boot.build-image.imageName=spring/actuator-prometheus

$ docker images | grep spring

$ docker images | grep spring/actuator-prometheus
spring/actuator-prometheus                                         latest                                          2b5438489b00   41 years ago    278MB
なんかCreatedがバグってる気がしますが、一旦はこれでOKです。
クラスターの設定 & 諸々のリソース作成
今回クラスターは以前のブログで作成したものを再利用しようと思います。構成としてはMinikubeで作ったクラスタにkube-promtheusを使ってPrometheusとGrafanaをデプロイ&設定を行っています。
PodMonitorを作成
通常、Prohetheusがk8sクラスタ内のサービスを見つける際にはkubernetes_sd_configをう場合が多いみたいですが、今回はkube-prometheusを利用しており、Kubernetes Operatorが利用できます。Kubernetes OperatorではPodMonitorとPodMetricsEndpointsというCRDが用意されており、そっちを利用してやってみようと思います。
以下のようなマニフェストファイルを用意します。
apiVersion: monitoring.coreos.com/v1
kind: PodMonitor
metadata:
  name: spring-app
  labels:
    backend: spring-app
spec:
  selector:
    matchLabels:
      app: spring-app
  podMetricsEndpoints:
  - port: app-port
  - path: /actuator/prometheus
ポイントはpodMetricsEndpointsのところで、ここにはPodで指定するポートの名前と、メトリクスを収集するPathを指定します。Actuatorはデフォルトでは/actuator/prometheusでメトリクスを公開しているので、そのパスを指定します。
作ったマニフェストをApplyしておきます。
$ kubectl apply -f pod-monitor.yaml
podmonitor.monitoring.coreos.com/spring-app created

$ kubectl get podmonitor
NAME         AGE
spring-app   19s
Doploymentを作成
それでは、Deploymentを作成して、作ったSpringのアプリをKubernetesにデプロイします。
まずは、--dry-runオプションを使ってベースとなるDeploymentを作成します。
$ kubectl create deployment spring-app --image=spring/actuator-prometheus --dry-run=client -o yaml
できたマニフェストを以下のように修正します。
apiVersion: apps/v1
kind: Deployment
metadata:
  creationTimestamp: null
  labels:
    app: spring-app
  name: spring-app
spec:
  replicas: 1
  selector:
    matchLabels:
      app: spring-app
  strategy: {}
  template:
    metadata:
      creationTimestamp: null
      labels:
        app: spring-app
    spec:
      containers:
      - image: spring/actuator-prometheus
        name: actuator-prometheus
        resources: {}
status: {}
このマニフェストを以下のように修正します。
apiVersion: apps/v1
kind: Deployment
metadata:
  creationTimestamp: null
  labels:
    app: spring-app
  name: spring-app
spec:
  replicas: 1
  selector:
    matchLabels:
      app: spring-app
  strategy: {}
  template:
    metadata:
      creationTimestamp: null
      labels:
        app: spring-app
    spec:
      containers:
      - image: spring/actuator-prometheus
        name: actuator-prometheus
        imagePullPolicy: IfNotPresent
        ports:
          - name: spring-app
            containerPort: 8888
        resources: {}
status: {}
具体的には
        imagePullPolicy: IfNotPresent
        ports:
          - name: spring-app
            containerPort: 8888
のところを追記しました。
imagePullPolicy: IfNotPresentはローカルにイメージがある場合はPullしないようの設定と、PodMonitorが利用するようにportに名前を付けています。
それではこのDeploymentをApplyします。
$ kubectl apply -f deployment.yaml
deployment.apps/spring-app created
Prometheusからメトリクスを確認する
実はここまでで大体設定が終わっていて、すでにPrometheusでのメトリクスの収集が始まってます。
Prometheusのダッシュボードでメトリクスを確認してみます。
まずは、デプロイされているプロメテウスにlocalhostでアクセスするためにポートフォワードを行います。
$ kubectl --namespace monitoring port-forward svc/prometheus-k8s 9090[f:id:yuya_hirooka:20210403140913p:plain]
Forwarding from 127.0.0.1:9090 -> 9090
Forwarding from [::1]:9090 -> 9090
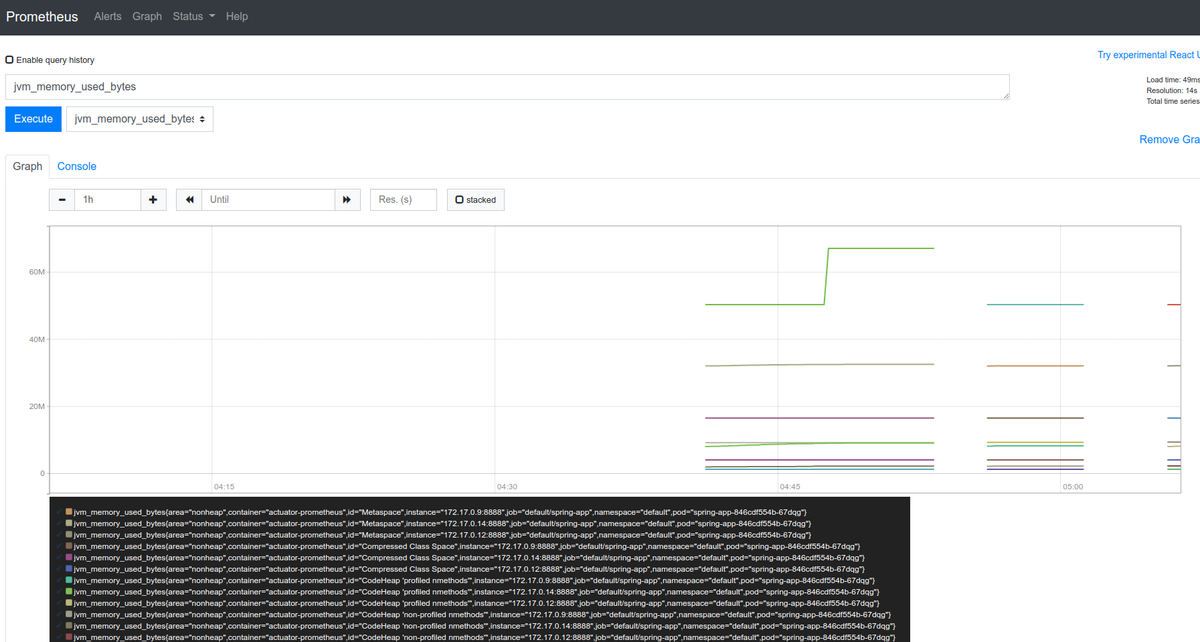
http://localhost:9090にアクセスしてUIから確認すると以下のようにJVMのメトリクスを取得できるようになっています。
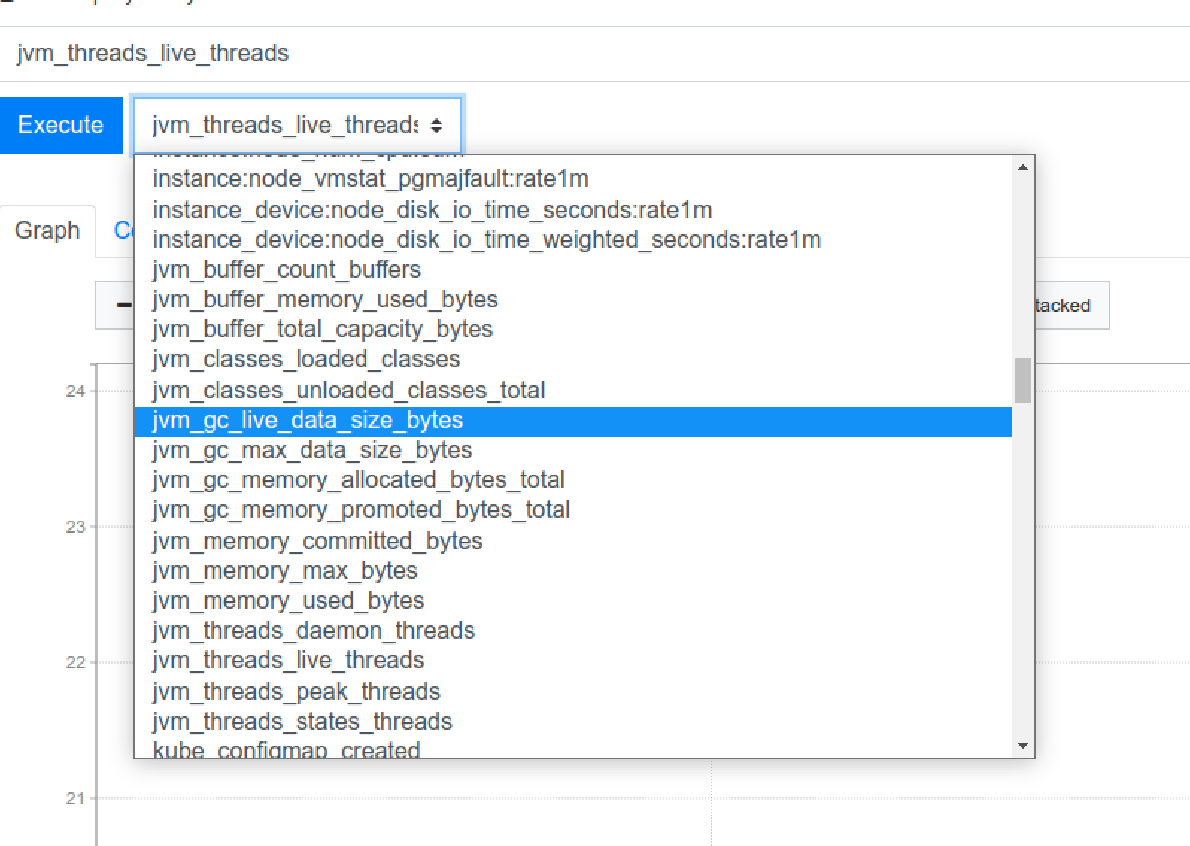
試しにjvm_memory_used_bytesをグラフ化してみると以下のようにヒープの領域ごとにいい感じにグラフ化できることが確認できました。
Minikubeにkube-prometheusを使ってPrometheusとGrafanaをデプロイする
はじめに
別のことがしたくて、Kubernetesクラスタの監視をPrometheus + Grafanaで行っている環境が欲しくて、いろいろ調べてたらkube-prometheusというのを見つけて、スターも多そうだったのでちょっと触ってみようと思います。
なおこのブログで特に指定がない場合はコンテキストはminikubeが指定されているものとします。
kube-prometheusとは
kube-prometheusはKubernetesのクラスターをPrometheusで監視を行ない簡単に運用していくくための諸々が用意されたアセットです。具体的には、以下のようなものが含まれます。
- Grafana
- Prometheus
- Prometheus Operator
- Kubernetesに対するネイティブデプロイメントとそのマネジメント機能を提供するKubernetes Operator
- Alertmanager
- Prometheusのようなクライアントアプリからのアラートをハンドルするコンポーネント
- Prometheus node-exporter
- *NIX kernelsによって公開されるOSのメトリクスのPrometheusエクスポーター
- Prometheus Adapter for Kubernetes Metrics APIs
- kube-state-metrics
- apiserverに問い合わせを行って、Kubernetes Objectsに関するメトリクスを行ってくれるコンポーネント
インストールしてみる
環境
動作環境は以下の通り
今回KubernetesのクラスタはMinikubeを用いてローカルに構成します。そのVMはデフォルトのDockerを利用します。
各ミドルウェア、OSのバージョンは以下のとおりです。
$ uname -srvmpio
Linux 5.4.0-70-generic #78-Ubuntu SMP Fri Mar 19 13:29:52 UTC 2021 x86_64 x86_64 x86_64 GNU/Linux

$ lsb_release -a
LSB Version:    core-11.1.0ubuntu2-noarch:security-11.1.0ubuntu2-noarch
Distributor ID: Ubuntu
Description:    Ubuntu 20.04.2 LTS
Release:    20.04
Codename:   focal


(Minikubeが動いているDocker)
$ docker version

(クライアントは省略)

Server: Docker Engine - Community
 Engine:
  Version:          20.10.5
  API version:      1.41 (minimum version 1.12)
  Go version:       go1.13.15
  Git commit:       363e9a8
  Built:            Tue Mar  2 20:16:15 2021
  OS/Arch:          linux/amd64
  Experimental:     true
 containerd:
  Version:          1.4.4
  GitCommit:        05f951a3781f4f2c1911b05e61c160e9c30eaa8e
 runc:
  Version:          1.0.0-rc93
  GitCommit:        12644e614e25b05da6fd08a38ffa0cfe1903fdec
 docker-init:
  Version:          0.19.0
  GitCommit:        de40ad0


$ minikube version
minikube version: v1.18.1
commit: 09ee84d530de4a92f00f1c5dbc34cead092b95bc


$ kubectl version -o yaml
clientVersion:
  buildDate: "2021-03-18T01:10:43Z"
  compiler: gc
  gitCommit: 6b1d87acf3c8253c123756b9e61dac642678305f
  gitTreeState: clean
  gitVersion: v1.20.5
  goVersion: go1.15.8
  major: "1"
  minor: "20"
  platform: linux/amd64
serverVersion:
  buildDate: "2020-12-08T17:51:19Z"
  compiler: gc
  gitCommit: af46c47ce925f4c4ad5cc8d1fca46c7b77d13b38
  gitTreeState: clean
  gitVersion: v1.20.0
  goVersion: go1.15.5
  major: "1"
  minor: "20"
  platform: linux/amd64
クラスターを構築する
公式のやり方通りにMinikubeを用いてクラスタを作ってみたいと思います。
以下のコマンドを実行します。
minikube start --kubernetes-version=v1.20.0 --memory=6g --bootstrapper=kubeadm --extra-config=kubelet.authentication-token-webhook=true --extra-config=kubelet.authorization-mode=Webhook --extra-config=scheduler.address=0.0.0.0 --extra-config=controller-manager.address=0.0.0.0
ここで、それぞれのオプションの意味は以下のようになっています。
bootstrapper:Bootstrapper(インストール前の環境をチェックするプログラム)の名前。デフォルトはkubeadm(今回明示的にやる必要は無かったかも)--extra-config:key=valueのペアで各コンポーネントに渡される設定。valueは.で区切られており最初のパートは設定を追加するコンポーネント(kubelet, kubeadm, apiserver, controller-manager, etcd, proxy, schedulerなどが選択可能)、後のパートは渡す設定値を示すようです。具体的にはそれぞれのコンポーネントに対して以下のようなオプションを渡しています。kubeletに対して渡すオプションとして--authentication-token-webhook=tureとauthorization-mode=Webhookを渡しています(オプションの意味はこちら)。- schedulerに対して
0.0.0.0にバインドするように設定 - controller-managerに対して
0.0.0.0にバインドするように設定
全体を通して、すごく重要そうなのはなさそうな印象ですね。ものによっては省略しても行けそうな気がしますが、変なところでつまりたくないので一旦公式に従っておきます。 ちなみに、それぞれのオプションの意味の詳細はここをご確認ください。 また、Kubernetesに関係するコンポーネントに関してはかこちらがよくまとまっています。
kube-prometheusはmetrics APIサーバーを含むたminikubeが持つmetrics-serverは不要となります。
以下のコマンドで、無効化されているか確認します。
$ minikube addons disable metrics-server
🌑  「metrics-server」アドオンは無効化されています
minikubeにkube-prometeusをインストールする
まず、動かしているクラスターのバージョンによって提供されているブランチを選択する必要があるようです。今回クラスターは1.20系で動かしているので、現状ではブランチはrelease-0.7かHEADを使う必要がありそうです。その他詳細な対応表に関してはこちらを確認してください。
今回はrelease-0.7を利用したいと思います。
以下のようにソースコードをクローンしてきて、release-07ブランチをチェックアウトします。
$ git clone https://github.com/prometheus-operator/kube-prometheus.git

$ cd kube-prometheus/

$ git checkout -b release-0.7 origin/release-0.7

$ git branch
  main
* release-0.7
チェックアウトまでできたら、必要なコンポーネントをクラスタにデプロイします。
kube-prometeusのセットアップは2段階で行なう必要があります。
* manifests/setupディレクトリに用意されているマニフェストでCRDs(Custom Resource Definition)とネームスペースを作成する
* CDRとネームスペースができたらmanifests配下にあるリソースをデプロイする
具体的には以下のコマンドを実行します。
$ kubectl create -f manifests/setup
$ kubectl create -f manifests/
ちなみにkube-prometeusを削除したい場合は以下のコマンドをを実行します。
$ kubectl delete --ignore-not-found=true -f manifests/ -f manifests/setup
Grafanaのダッシュボードを確認する
デプロイされたGrafanaとPrometheusのダッシュボードにアクセスするためには以下のコマンドでポートフォワードを行います。
$ kubectl --namespace monitoring port-forward svc/prometheus-k8s 9090 & \
 kubectl --namespace monitoring port-forward svc/grafana 3000
Forwarding from 127.0.0.1:9090 -> 9090
Forwarding from [::1]:9090 -> 9090
Forwarding from 127.0.0.1:3000 -> 3000
Forwarding from [::1]:3000 -> 3000
Prometheusはhttp://localhost:9090、Grafanaはhttp://localhost:3000でそれぞれアクセスできます。
Grafanaの画面にアクセスするとデフォルトで諸々の設定を行ってくれたダッシュボードを確認することができます。


NginxのPodをデプロイしてメトリクスを見てみる
最後に1つネームスペースを作ってNginxのPodをデプロイしてみて、可視化されたメトリクスを確認してみたいと思います。
こちらのマニフェストを使ってNginxのPodを1つのレプリケイトで作るDeploymentを作成します。
まずは、ネームスペースを作成します。
$ kubectl create ns nginx-ns
次にDeoloymentを作成します。
$ kubectl -n nginx-ns apply -f https://raw.githubusercontent.com/samuraiball/settings/master/kubernetes/double-nginx-sample/deployment.yaml
deployment.apps/nginx-first created
deployment.apps/nginx-second created

$ kubectl -n nginx-ns get po
NAME                            READY   STATUS    RESTARTS   AGE
nginx-first-d6db6c668-mpbk7     1/1     Running   0          42s
nginx-second-6b8d5c9696-wdt75   1/1     Running   0          42s
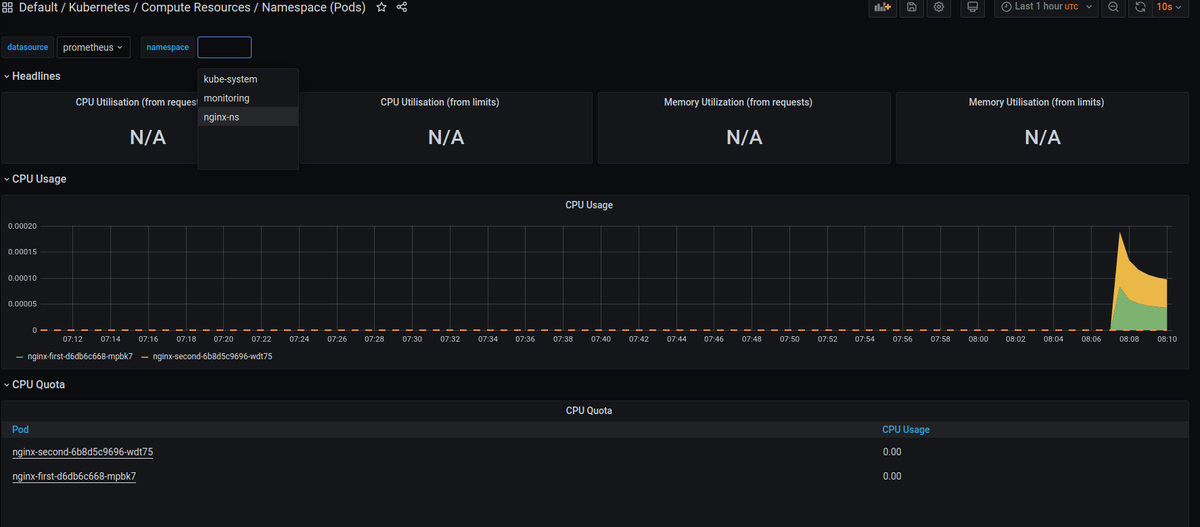
この状態でGrafanaの左サイドメニューからSearchを選択し、「pod」で検索します。
検索結果一覧のなかからKubernetes / Compute Resources / Namespace (Pods)を選択します。
画面上部のnamespaceでnginx-nsを選択するとデプロイしたNginxのPodのメトリクスがきちんと